Metrics
How the numbers on the Strategy Miner, the Vault, the Builder backtest and the prop-firm check are calculated, with the formulas.
This page defines the numbers shown on screen. Each section says where the number appears and how it is calculated. For a plain explanation of a term, follow the link to the glossary.
- Every number here comes from a backtest on past price bars. It is an approximate backtest, not a definitive result, and past results do not guarantee future results.
- The Miner and the Builder backtest are separate calculations, and a few definitions differ. The differences are named below.
Profit factor (PF)
PF is gross profit divided by gross loss. Gross loss is the sum of the losing trades, taken as a positive number. A PF above 1 means the winners were larger than the losers in total.
- If there are no losing trades and at least one winner, the Miner shows 999.
- If there are no winning trades, PF is 0.
- PF (search period) and PF (later period) in the Vault use the same formula on each part of the data.
See the glossary entry for profit factor.
Max drawdown (Max DD %)
Max DD is the largest fall of the account balance from a previous peak, as a percent of that peak.
- The Miner builds a balance curve from closed trades, starting at a deposit of 10,000. After each trade it compares the balance with the highest balance so far. Max DD % is the largest such fall.
- The Builder backtest uses the same 10,000 deposit and the same closed-trade method. It also keeps the largest fall in money, which it uses for the recovery factor.
- Losses inside a trade that is still open are not part of this number.
See the glossary entry for maximum drawdown.
DD including open losses
When a candidate is searched with the realistic-cost settings, its card shows this line: “Equity max DD {n}% (open trades included)”. It is measured like Max DD %, but bar by bar, so a trade that is losing at that moment counts.
- On each bar the Miner measures the open trade at the worst price of the bar and also at the close. It compares the lower equity of the two with the highest equity so far.
- This number is equal to or larger than Max DD %. A large gap means the strategy sat in deep open losses between closed trades.
SL and TP in the same bar
A price bar gives only open, high, low and close. When one bar reaches both the stop loss and the take profit, the data cannot say which came first. The same card shows how many times this happened: “SL and TP both reached in the same bar: {n}”.
The Miner decides the order with a fixed rule.
- If the bar closed above its open, the low is assumed to come first. A long trade hits its stop loss, and a short trade hits its take profit.
- If the bar closed below its open, the high is assumed to come first. A long trade hits its take profit, and a short trade hits its stop loss.
- If the close equals the open, the stop loss is assumed to come first.
The count shows how much the result depends on this rule. A high count means the result rests on guesses about the order inside bars.
Trades
Trades is the number of closed trades in the period. A result with few trades is easy to get by chance. The Miner has a minimum number of trades for a candidate. The demo fixes that minimum. The Vault shows Trades next to PF so the two can be read together.
Net profit ÷ max drawdown
Net profit ÷ max drawdown is net profit divided by the largest fall of the closed-trade profit curve, both in USD at the test lot size. The Vault column that shows it is named Profit/DD.
- The Vault builds the curve from the cumulative profit of each closed trade. The largest fall is from a peak of that curve to a later low.
- If the curve never fell, the value is not shown.
- The Builder backtest calls the same idea “Recovery” (recovery factor): net profit divided by max drawdown in money.
See the glossary entry for recovery factor.
Other Vault columns
You choose which columns the Vault shows with the Columns button above the table.
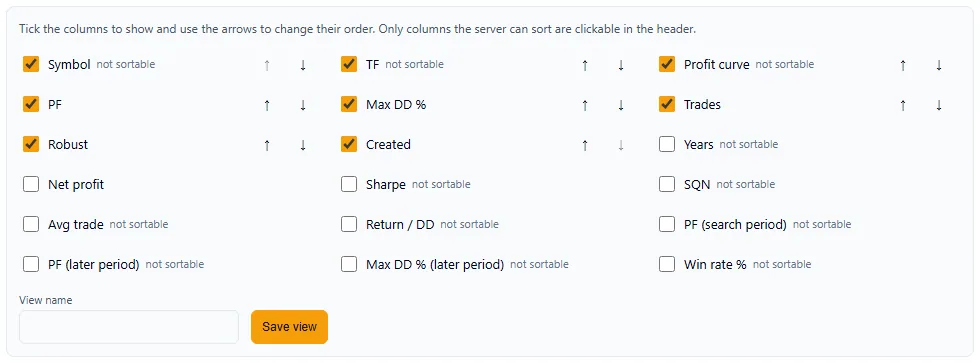
| Column | Definition |
|---|---|
| Net profit | Gross profit minus gross loss over all trades. |
| Avg trade | Net profit divided by the number of trades. See expectancy. |
| Win rate % | Winning trades divided by all trades. See win rate. |
| Sharpe | The mean trade result divided by the standard deviation of trade results. It is per trade, not annualized, and uses the sample standard deviation (n - 1). It is not shown with fewer than 2 trades. See Sharpe ratio. |
| Trade quality score | The square root of the number of trades, times the mean trade result, divided by the standard deviation of trade results. |
| Robust | The number of other symbols on which the candidate also passed the robustness check, out of the number tested. |
| Max DD % (later period) | Max DD % calculated on the later period only. |
Builder backtest figures
The Strategy Builder backtest shows these figures.
| Label | Definition |
|---|---|
| PF (full period) | Profit factor over all trades. |
| PF (unseen period) | Profit factor of the last 30% of the trades in time order. The first 70% is the period the design was built on. |
| Max DD | Max drawdown percent on a 10,000 deposit. |
| Win rate | Winning trades divided by all trades. |
| Expectancy | Net profit divided by the number of trades. |
| Recovery | Net profit divided by max drawdown in money. |
| Sharpe (annual) | The per-trade Sharpe ratio (mean divided by the population standard deviation) times the square root of the number of trades per year. |
| Max losing streak | The longest run of consecutive losing trades. |
| Payoff | The average winning trade divided by the average losing trade. See risk-reward ratio. |
The Builder’s Sharpe is annualized and uses the population standard deviation. The Vault’s Sharpe is per trade and uses the sample standard deviation. The two numbers cannot be compared.
Combined strategies
When you combine strategies in the Vault, the combined figures are calculated on daily results.
- PF, net profit over drawdown and Sharpe are calculated on the daily profit and loss of the combination.
- Correlation is the correlation of the daily profit and loss of two strategies.
- The drawdown ratio is the drawdown of the combination divided by the sum of the drawdowns of its strategies, each taken at its size in the combination. The screen shows it as a percentage (the tile “Drawdown vs. each alone”). A value below 100% means combining reduced the drawdown.
VaR and CVaR
The prop-firm check reports a daily VaR and CVaR at 95%. They are measured on your record in its original order, scaled to the account size of the plan.
- Take the daily change of the account as a percent of the starting balance.
- VaR (95%) is the loss at the 5th percentile of those daily changes, shown as a positive number. On 95 of 100 days the loss was smaller.
- CVaR (95%) is the average of the daily changes at or below that 5th percentile, shown as a positive number. It is the average size of the bad days.
See the glossary entry for value at risk.
Prop-firm check figures
The Risk figures table of the prop-firm check also shows these rows.
| Label | Definition |
|---|---|
| Worst daily loss (closed trades) | The largest one-day loss from closed trades, shown against the firm’s daily limit. |
| Days that would have broken the daily limit | The number of days on which the loss passed the limit. |
| Share of days with a gain | Days with a profit divided by all trading days. |
| Longest time below the previous peak | The longest run of trading days without a new equity high. |
| Monthly return volatility | The standard deviation of monthly returns, in percentage points. |
The pass rates in the same report come from many random replays of your daily results against the firm’s rules. They are estimates and depend on the record you load. See Free tools for what the report shows to everyone and what is part of Pro.