Backtest in the Builder
Run Measure on a flow, read the result cards, and use the robustness matrix. Needs a verified email, not Pro.
Measure runs your flow on past price data and shows how it would have traded. It is an approximate bar-level test, not the MetaTrader 5 Strategy Tester. Results are approximations on past data and do not guarantee the future.
What you need
- A flow on the canvas.
- A signed-in account with a verified email address. You do not need Pro.
If you are not signed in, Measure and Robustness matrix show “Sign in to measure strength. Measurement is free.” as soon as you click, and nothing is sent. If the account’s email is not verified, it says “Your account is not eligible yet. Please verify your email address and try again.”
Run a measurement
-
Click Measure in the header.
-
Set the fields in the table below.
-
Click Measure. The result appears in the same window.
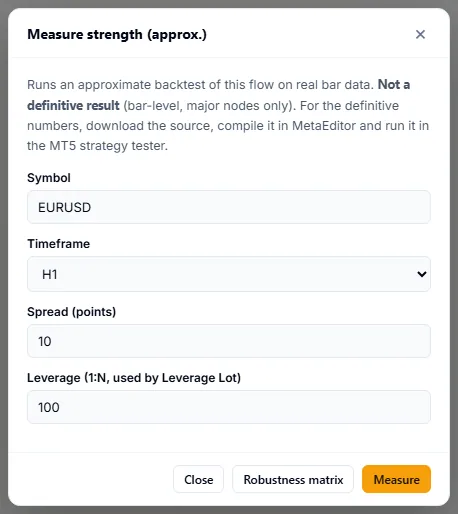
The Measure window before a run: Symbol, Timeframe, Spread and Leverage.
| Setting | What it does | Values |
|---|---|---|
| Symbol | The market the flow trades in the test. | A symbol such as EURUSD. Default EURUSD. |
| Timeframe | The bar size. | M15, M30, H1, H4, D1. Default H1. |
| Spread (points) | The spread added to each trade, in points. | 0 to 1000. Default 10. |
| Leverage (1:N) | The account leverage. It is used by the Leverage Lot block, and it decides whether a trade has enough margin. | 1 to 3000. Default 100. |
The button Robustness matrix runs the flow on several markets at once. See below.
Some flows are measured in your browser with the same engine the Strategy Miner uses, for example a flow opened from a Miner result. Other flows are measured on the server. The result window looks the same.
Read the result
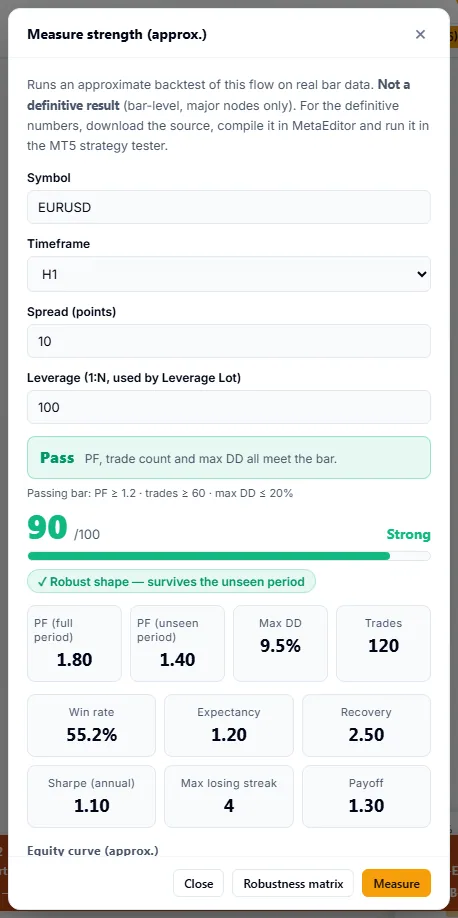
The window starts with a verdict and the passing bar (“Passing bar: PF ≥ 1.2 · trades ≥ 60 · max DD ≤ 20%”). Below it is a strength score out of 100 with a label of Strong, Average or Weak. A badge next to it says “Robust shape — survives the unseen period” or “Possible overfit — strong only on the in-sample period” when the numbers show one of those. After that come the cards.
| Verdict | Meaning |
|---|---|
| Pass | The result met all three limits in the next paragraph. |
| Fail | At least one limit was missed. |
| Thin sample | There were few trades, so the numbers are not reliable. |
| No trades | The flow placed no trades. |
| Too few trades | Fewer than 10 trades. No verdict is given. |
The pass limits are profit factor (PF) of at least 1.2, at least 60 trades, and a maximum drawdown of at most 20%. A pass means the numbers cleared this bar on this data. It does not predict future results.
The cards:
| Card | What it shows |
|---|---|
| PF (full period) | Profit factor over all trades. |
| PF (unseen period) | The same measure on the last 30% of trades, a period not used for tuning. The further it falls below the full-period PF, the more the flow may be fitted to the past. |
| Max DD | The largest fall from a peak in the equity curve. |
| Trades | The number of trades. |
| Win rate | The share of winning trades. |
| Expectancy | The average result per trade. |
| Recovery | The recovery factor. |
| Sharpe (annual) | The annualised Sharpe ratio. |
| Max losing streak | The longest run of losing trades. |
| Payoff | The payoff ratio. |
Below the cards are an equity curve and a monthly heatmap.
The window can show notes under the result:
- Unsupported nodes. Some blocks are not simulated. The note lists them, and they are not reflected in the estimate.
- Multi-timeframe is approximated. A flow that reads another timeframe is simulated with an approximation.
- Margin skips and stop-outs. Trades the account could not afford were skipped, or the account was stopped out.
- Approximate (bar-level, not a real tester). The test uses bars, so it cannot see what happened inside a bar. Numbers will differ from a MetaTrader 5 run and from the Strategy Miner.
Robustness matrix
The matrix runs the same flow on the selected symbol and on EURUSD, USDJPY, GBPUSD and AUDUSD, on one timeframe. It shows at most 5 cells. The table has one row per market, with the columns Market, PF, Unseen PF, DD and Trades. A green dot means the row survived (unseen PF at least 1.0 and at least 30 trades), and a red dot means it did not. Under the table the window counts the surviving rows, and a Holdout forward line shows a test on the last 6 months, which was not used for tuning. A market with no data stays in the table with the reason, and a note says how many of the markets were measured.
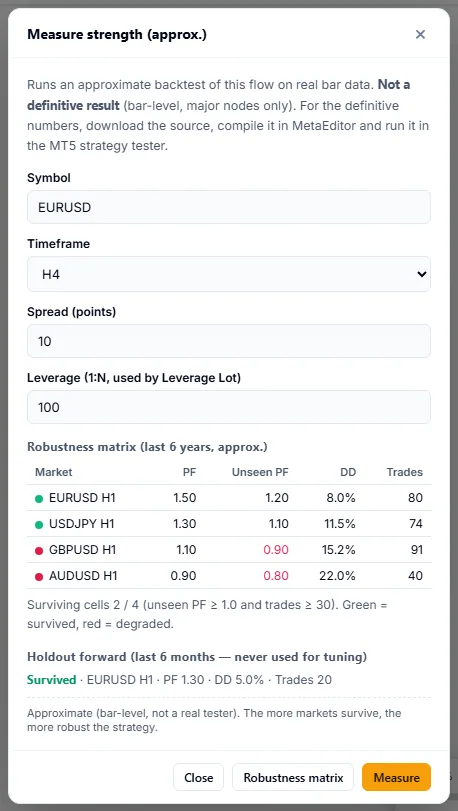
A flow that passes on one market and fails on the others may be fitted to that market.
Messages
| Code | When it appears |
|---|---|
| E601 | You are not signed in, or the account is not eligible. |
| E602 | Your session has expired. Sign in again. |
| E501 | The measurement service is not available. Try later. |
| E502 | The measurement timed out, or the request did not reach the server. Try a shorter timeframe, then run again. |
| E503 | No price data for that symbol and timeframe, or too many combinations. Use a major pair such as EURUSD or USDJPY. |
| E504 | The engine could not evaluate the flow. |
| E505 | You hit the rate limit, or the queue is full. Wait and try again. |
Why numbers differ from other tools
The Builder, the Strategy Miner and the MetaTrader 5 tester use different price data, spreads and fill rules. A flow can pass in one and fail in another. Treat Measure as a quick check on a flow’s shape, and test the code yourself in MetaTrader 5 before you use it.