Combine strategies Pro
Select strategies in the Vault and see how their daily profit and loss add up, how they move together, and how big each one should be.
This feature is part of Pro.
Combine adds up the daily profit and loss of the strategies you selected. It shows how they move together. It is not a forecast. Combine is part of Pro. Without Pro the screen shows a sample with made-up numbers.
Open the combined view
- Open the Vault.
- Tick 2 to 40 strategies.
- Click Combine. The button is enabled only for a selection in that range. Above 40, the button stays disabled and its tooltip says “Select up to 40 strategies to combine.”
The Miner recalculates each strategy on your device from its price bars, because the Vault stores designs and metrics but not bars. The screen shows “Recalculating n of m strategies on this device…” while it works. Strategies that cannot be recalculated here are listed under “Not included (could not be recalculated here)”.
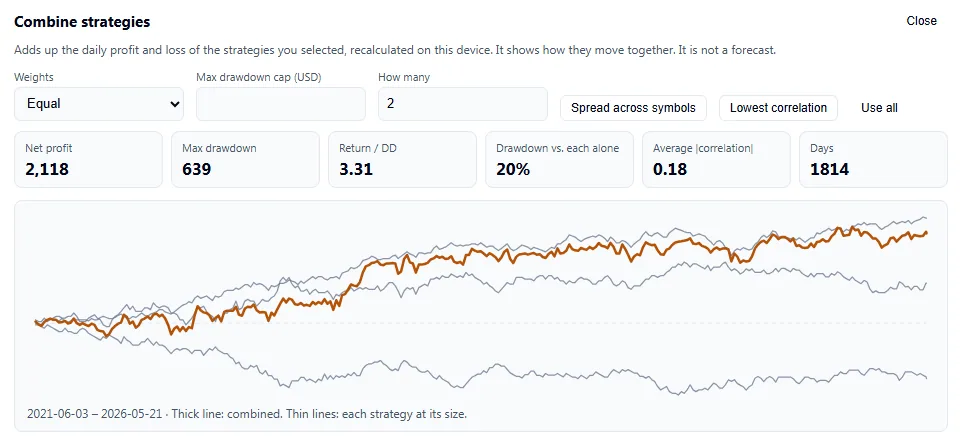
Set the weights and the drawdown cap
| Setting | What it does | Values |
|---|---|---|
| Weights | Decides how large each strategy is relative to the others. | Equal; Inverse volatility (a strategy with smaller daily swings gets a larger share); Manual (type a percentage in the Weight % column) |
| Max drawdown cap (USD) | Scales sizes down until the combined drawdown fits the cap. Sizes are only reduced, never increased. | A number in USD. Empty means no cap. |
| Use (checkbox on each row) | Leaves one strategy out of the sum. | Ticked or not |
Let the Miner choose a subset
If the Vault selection is larger than you want to combine, enter How many (2 to 40) and use one of these buttons.
| Button | What it does |
|---|---|
| Spread across symbols | Takes strategies in turn from different symbols, keeping rank order, so one symbol does not dominate. |
| Lowest correlation | Starts from the first strategy and keeps adding the one whose average absolute correlation with those already chosen is lowest. |
| Use all | Goes back to every selected strategy. |
Read the result
| Tile | Meaning |
|---|---|
| Net profit | Sum of the strategies’ daily profit at the sizes shown. |
| Max drawdown | Largest fall from a peak of the combined daily profit, in USD. |
| Net profit ÷ max drawdown | Net profit divided by maximum drawdown. |
| Drawdown vs. each alone | Combined maximum drawdown divided by the sum of each strategy’s own maximum drawdown, each multiplied by its multiplier in the combination. Below 100% means their losing stretches did not line up. |
| Average |correlation| | Average absolute correlation between the strategies’ daily profits. Lower means they move less alike. |
| Days | Number of days in the combined series, from the first to the last trade day. |
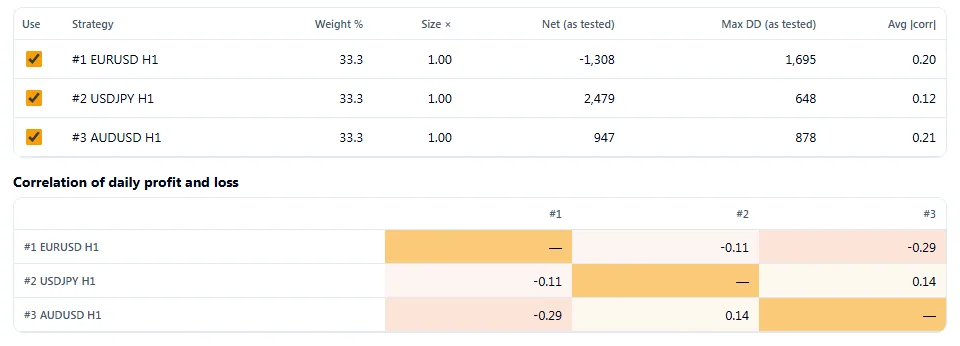
- The members table lists Use, Strategy, Weight %, Size ×, Net (as tested), Max DD (as tested) and Avg |corr|. Size × is the lot multiplier against the size each strategy was tested at (1.0 means unchanged).
- A correlation table shows every pair.
- Close the view with Close.
Combining past results does not forecast future ones. A low correlation in the past can rise later.
Where to go next
- Back to the Vault.
- Check one strategy against prop-firm rules: Prop-firm check.
Related reference: Metrics defines the combined figures.