Reading results
What the Strategy Miner shows after a run - the summary line, the Checks table, the candidate card, the vault table and the profit curve - and how to read each number.
This page explains what you see after a run and what each number means. All numbers come from a backtest on past price bars with simplified assumptions. They do not guarantee future results, and a good number here is a reason to test further, not a reason to trade.
The summary line and the Checks table
When a run ends, a summary line says how many candidates were kept out of how many trials, and how long the run took. In Pro it also shows how many duplicates were removed, how many candidates the robustness checks passed and dropped, how many parallel workers ran, and how many candidates were skipped because they repeat results already in your vault.
Below it, the Checks table shows the passed and dropped counts for each check. See How candidates are filtered for how to read it.
If nothing survives, the Miner says “No candidate passed every check this time” and suggests more trials, another symbol, or a lower minimum trade count.
The candidate card
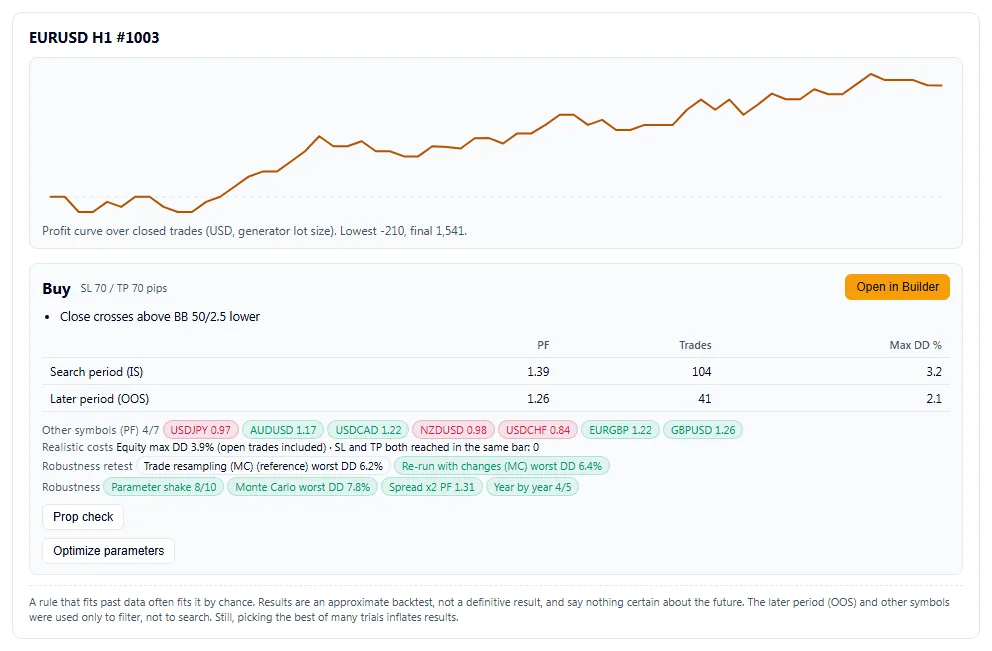
In Pro, each candidate has a card. A run does not show the cards on their own: click a strategy number in the vault table and the card opens below it. In the demo, you see only tick and cross marks per check and no conditions.
A card shows these parts, from top to bottom.
| Part | What it shows |
|---|---|
| Header | The direction (Buy or Sell), the stop loss and take profit in pips (such as “SL 40 / TP 80 pips”), and the Open in Builder button. |
| Conditions | The entry conditions. If the strategy uses entry hours or extra filters, they are listed under “And only when:”. |
| Results table | PF, Trades and Max DD %, for the Search period (IS) and the Later period (OOS). |
| Other symbols (PF) | A count such as 4/7 (the other symbols that passed, out of the other symbols tested; with the default 8 built-in symbols there are 7 others), and one chip per symbol with its PF. A green chip passed. |
| Realistic costs | Only if Realistic costs was on: the equity drawdown and the number of bars where the stop and the target were both reached. |
| Robustness retest | One chip per re-check test. See Robustness re-check. |
| Robustness | One chip per robustness test: Parameter shake, Monte Carlo, Spread x2 and Year by year. |
| Buttons | Prop check and Optimize parameters. |
The numbers
| Number | Meaning |
|---|---|
| PF | Profit factor: the total profit of winning trades divided by the total loss of losing trades. Above 1 means the trades made a profit in the backtest. |
| Trades | The number of closed trades in that period. A small count makes every other number less certain. |
| Max DD % | The largest fall of the account balance from a peak, measured on closed trades only. |
| Equity max DD | The same fall, but measured bar by bar and including open trades, so it can show a deeper fall than Max DD %. It appears when Realistic costs is on. |
| SL and TP both reached in the same bar | Bars where one bar reached both the stop and the target. A bar does not say which came first, so the Miner uses a fixed rule. A high count means the result depends on that rule. It appears when Realistic costs is on. |
| Search period (IS) and Later period (OOS) | The first and the last part of the bars. The search ranked trials on the first part only. |
| Other symbols (PF) | How many of the other symbols the rule also worked on. |
| Net profit, Avg trade, Sharpe, Trade quality score, Profit/DD, Win rate % | Extra columns of the vault table, available in the All numbers view. Sharpe and Trade quality score are calculated per trade, not per year. |
A PF on the later period that is much lower than on the search period is a common sign that the rule fit the past by chance.
The vault table
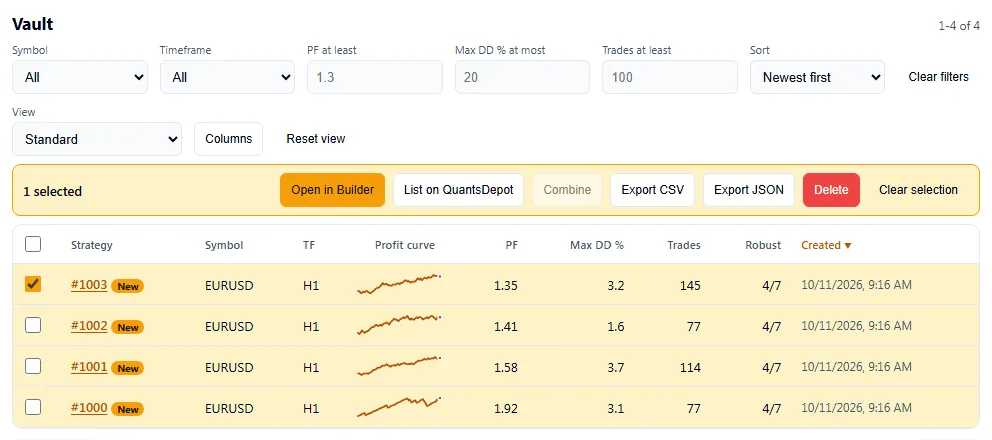
Pro saves every candidate of a run to your vault automatically. The table lists them, newest first.
- Click a column name that has a sort mark to sort by it. The sortable columns are PF, Max DD %, Trades, Robust, Net profit and Created.
- Filter by Symbol, Timeframe, PF at least, Max DD % at most and Trades at least.
- Choose the columns with the view list: Standard, Robustness first or All numbers. You can save your own view. Views are kept in this browser.
- The Robust column shows on how many of the other symbols tested a candidate also passed, such as 4/7. It is not the count of re-check tests.
- Tick rows to act on them. The bar above the table offers Open in Builder, List on QuantsDepot, Combine, Export CSV, Export JSON, Delete and Clear selection.
- Click a strategy number (such as
#12) to open its detail card below the table.
The vault keeps up to 10,000 strategies per account. When it is full, the Miner shows “The vault is full” and stops saving until you delete some.
The profit curve
The table has a small Profit curve column, and the detail card shows a larger one. It plots the running total profit across closed trades, in USD, at the generator’s fixed lot size. The caption gives the lowest point and the final value. Both are cut down to a small number of points.
A curve that rises steadily is more reassuring than one that jumps on a few trades. A curve is still a picture of the past.
Next steps
- Open in Builder lays the strategy out as a flow of blocks, so you can change it and export it. The Quickstart shows the steps.
- Keep a candidate in the vault for later. The vault also skips repeats in later runs.
- Optimize parameters on the card tunes the settings of the same strategy. It saves the result as a new vault row and leaves the original unchanged.
A rule that fits past data often fits it by chance. The later period and the other symbols were used only to filter, not to search. Still, picking the best of many trials makes the results look better than they will in a new period.
Related reference: Metrics defines every number on a candidate.