Indicator mode
Build a custom MetaTrader 5 indicator from blocks, preview it for free, and use it in an EA.
Indicator mode builds a custom indicator for MetaTrader 5 instead of a trading strategy. You wire price, built-in indicators and math into plots. The Builder draws the result on sample data. Seeing the code, downloading the .mq5 file and the Use in an EA tab need Pro.
Switch to Indicator mode
- Open the Strategy Builder.
- Use the EA / Indicator switch in the header and choose Indicator.
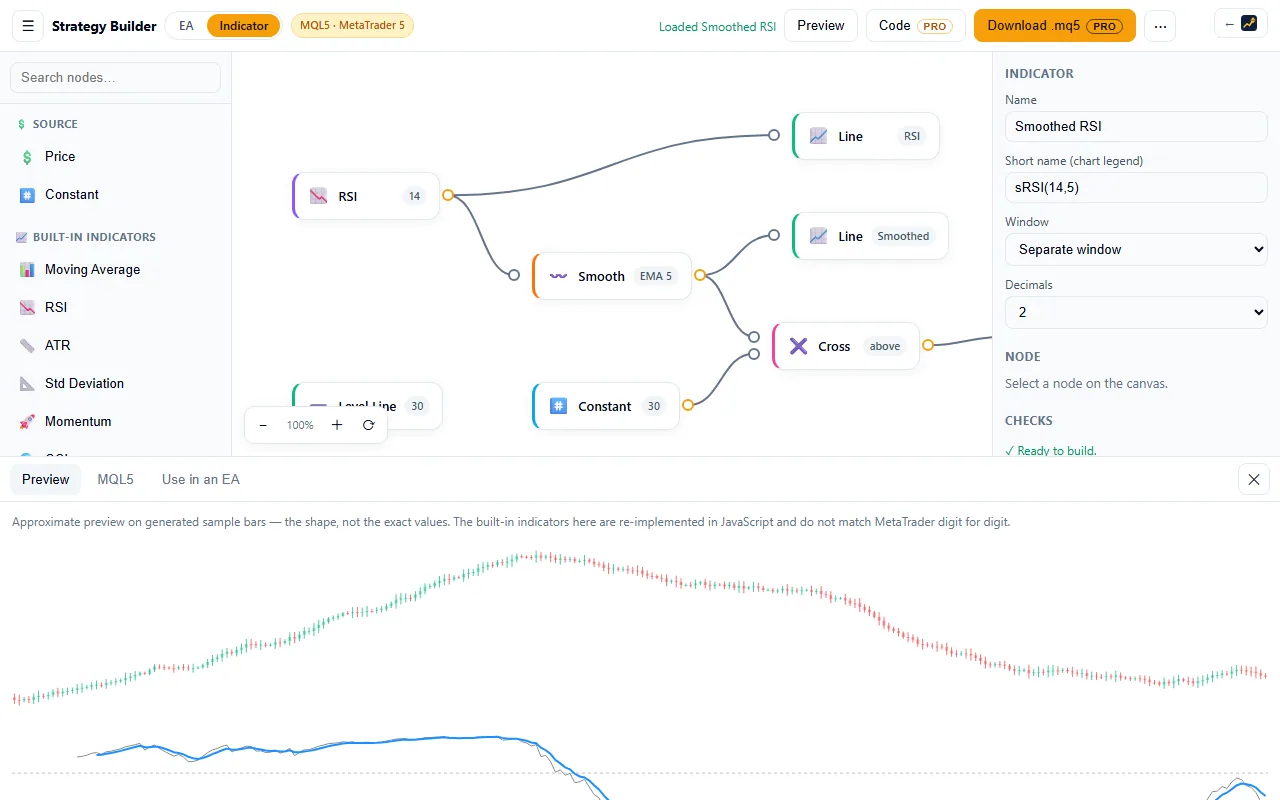
The header of Indicator mode has Preview, Code and Download .mq5 (the last two are marked PRO) and a ⋯ menu with Export JSON, Import JSON, Templates… and Clear canvas. The palette on the left lists Source, Built-in Indicators, Math, Signals and Plots blocks.
Indicator mode is a separate page with its own canvas. It does not change the EA flow you were working on. The Builder keeps the indicator flow in this browser, separately from your EA projects, and it is not saved to your account.
What is free and what needs Pro
| Feature | Access |
|---|---|
| Place and connect blocks | Everyone |
| Preview, which draws the indicator on sample data | Everyone |
| Export JSON and Import JSON in the ⋯ menu | Everyone |
| Code and Download .mq5 (the code is shown in the MQL5 tab) | Pro only |
| Use in an EA | Pro only |
Without Pro, the screen shows no code. Code and Download are marked PRO. If you are not signed in, pressing them shows “Sign in to unlock the source”. If you are signed in without Pro, they show “Editable .mq5 source is a Pro feature”. Both have a See Pro plans link.

Preview draws the indicator on generated sample bars, with a note that it shows the shape and not the exact values. The built-in indicators in the preview are written again in JavaScript, so they do not match MetaTrader digit for digit.
Blocks
Blocks are grouped by category. Wire values from left to right: sources, then indicators and math, then plots.
| Category in the palette | Blocks |
|---|---|
| Source | Price, Constant |
| Built-in Indicators | Moving Average, RSI, ATR, Std Deviation, Momentum, CCI, Bollinger Bands, MACD, Stochastic, ADX, Williams %R |
| Math | Arithmetic, Scale & Offset, Absolute Value, Smooth, Highest, Lowest, Standard Deviation, Value N Bars Ago, Change |
| Signals | Cross, Compare |
| Plots | Line, Histogram, Arrow, Level Line |
An indicator needs at least one Plot block. The plot is what MetaTrader 5 draws.
Indicator settings
The right panel has the settings for the whole indicator.
| Setting | What it does | Values |
|---|---|---|
| Name | The name used for the file and in MetaTrader 5. | Text |
| Short name (chart legend) | The short name shown in the chart legend. | Text |
| Window | Where the plots are drawn. | Separate window, or On the price chart |
| Decimals | How many decimals the values show. | Same as the symbol, or 0 to 5 |
Select a block to edit its settings under Node. Parameters you expose become inputs of the indicator in MetaTrader 5.
Checks
The Checks list shows problems as you edit, or “Ready to build.” when there are none. Download is disabled while an error is present. Warnings do not block it. The first time you open Indicator mode, the Smoothed RSI template is already on the canvas, so Checks says “Ready to build.” After Clear canvas the canvas is empty and Checks says “No Plot node”.
| Level | Message |
|---|---|
| Error | No Plot node — an indicator that draws nothing cannot be built. |
| Error | Plot “name” has nothing wired into it. |
| Error | The flow loops back on itself — remove the cycle. |
| Error | Too many nodes — MetaTrader allows at most 512 indicator buffers. |
| Warning | Block has no input — it will output 0. |
| Warning | Block uses the constant B (value) because only A is wired. This applies to Arithmetic, Cross and Compare. |
| Warning | Block does not reach any Plot — it will be left out of the indicator. |
The “Too many nodes” error appears above 480 blocks. Constant and Level blocks are not counted; Plot blocks are.
Templates
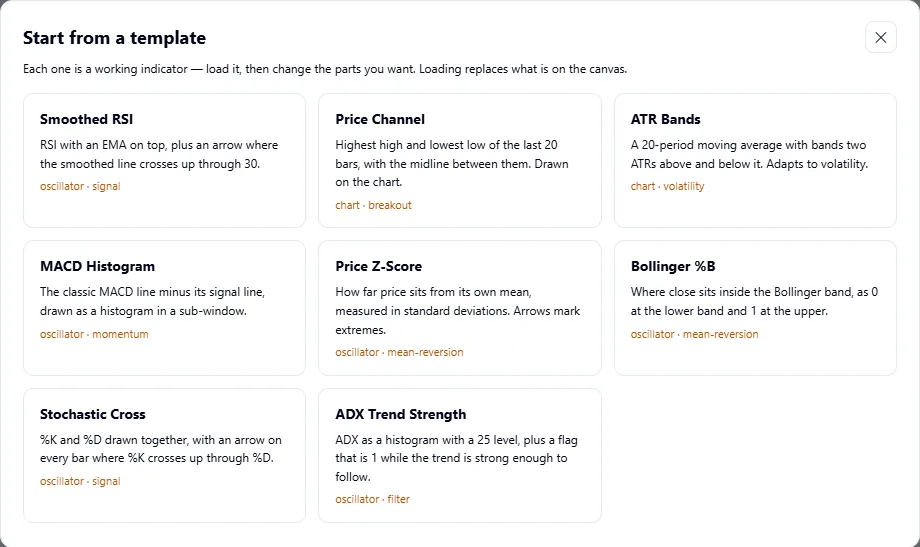
Open the ⋯ menu and choose Templates… to start from an example. They are Smoothed RSI, Price Channel, ATR Bands, MACD Histogram, Price Z-Score, Bollinger %B, Stochastic Cross and ADX Trend Strength. Loading one replaces the flow on the canvas.
Use the indicator in an EA (Pro)
- Download the
.mq5file with Download .mq5. - Put the file in the
MQL5\Indicatorsfolder of your MetaTrader 5 data folder. - Open it in MetaEditor and compile it (F7) so the
.ex5appears next to it. - Open the Use in an EA tab. It shows the indicator name, the iCustom arguments in order, and for each plot a buffer number and an Open in Strategy Builder (EA) button.
- Click the button for the plot you want. The Strategy Builder opens in EA mode with a block that reads that plot through
iCustom.
Plot buffer numbers follow the order of the plots, not their position on the canvas. If you add, remove or reorder plots, open the tab again and use the new buttons, then compile the new indicator file.
The link the button opens has the form /strategy-builder?icustom=<name>&icparams=<values>&icbuf=<n>. You can also use one from your own notes.
The indicator is drawn from past prices. It does not predict future prices.