Vault Pro
Where the Strategy Miner keeps your candidates, how to sort, filter and export them, and how repeats are skipped.
This feature is part of Pro.
The Vault is the table at the bottom of the Strategy Miner. It keeps the candidates from every run in your account. The Vault is part of Pro. Without a Pro account the table shows a note instead: “The vault is part of Pro.”
What the Vault keeps
When a run ends, the candidates that passed the checks are saved to your account automatically. A line under the result confirms it, for example “Saved 5 to your vault (stored on your account).”
- Each row stores the strategy design, its metrics and the settings of the run.
- Price bars are not saved.
- The Vault keeps up to 10,000 strategies per account. When it is full, the line reads “The vault is full”, and you have to delete rows before the next run can save.
- A failed save does not stop or discard the run. The line under the result says so and the result stays on screen.
Skip repeats in later runs
Before a run, the Miner reads which designs and trade patterns your Vault already holds. It drops candidates that repeat them for the same symbol and timeframe, so later runs do not fill the Vault with copies.
- The result adds how many were dropped, for example “Skipped 3 that repeat results already in your vault.” If the account already held a candidate when it was saved, the line under the result adds “n were already there.”
- If the Vault cannot be read, the run goes on without this check. The line says “Could not read your vault, so repeats of earlier results were not removed this time.”
- If you delete a row, a later run may produce that strategy again.
Find strategies
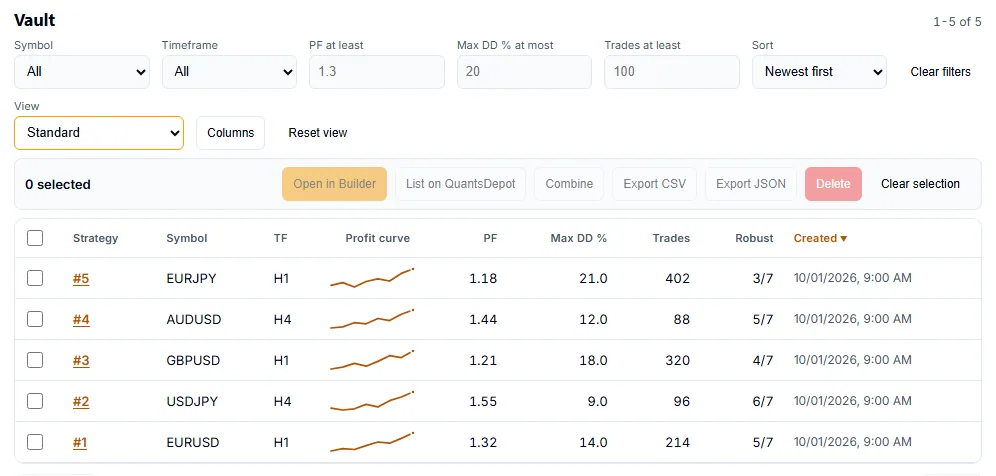
The table shows 50 rows per page. Use Previous and Next to move between pages.
| Setting | What it does | Values |
|---|---|---|
| Symbol | Shows one symbol only. | All, or a symbol |
| Timeframe | Shows one timeframe only. | All, or one of M15, M30, H1, H4, D1 |
| PF at least | Hides rows below this profit factor. | A number, for example 1.3 |
| Max DD % at most | Hides rows with a larger drawdown. | A number, for example 20 |
| Trades at least | Hides rows with fewer trades. | A number, for example 100 |
| Sort | Orders the rows. | Newest first, Oldest first, PF high to low, Max DD low to high, Trades most first, Robustness most first, Net profit high to low |
Click Clear filters to remove all filters. You can also sort by clicking a column header. Only columns the server can sort are clickable.
Choose the columns and views
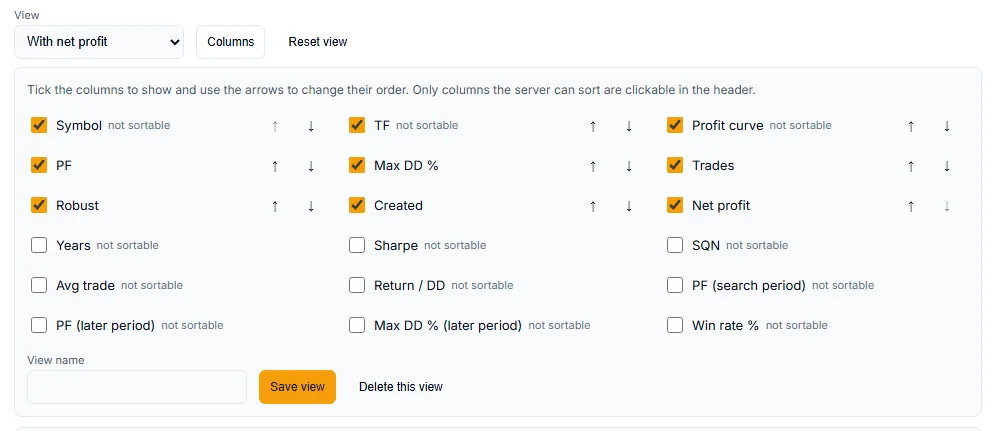
- Click View to pick a ready-made layout: a standard one, one that puts robustness first, or one that shows every number.
- Click Columns, tick the columns to show, and use the arrows to change their order.
- To keep a layout, type a View name (up to 30 characters) and click Save view. Select it later under View, or click Delete this view to remove it.
- Click Reset view to go back to the standard layout.
Your views are stored in this browser, not in your account.
| Column | What it shows |
|---|---|
| Symbol, TF, Years | What the run searched on. |
| Profit curve | A small curve of the strategy’s profit. |
| PF, Max DD %, Trades | Profit factor, maximum drawdown and trade count over the whole tested period. |
| Robust | On how many of the other symbols tested the strategy also passed, such as 4/7. |
| Net profit, Sharpe, Trade quality score, Avg trade, Profit/DD | More metrics from the same period. |
| PF (search period), PF (later period), Max DD % (later period) | The same metric on the search period and on the later period that the search did not use. |
| Win rate % | Share of winning trades. |
| Created | When the row was saved. |
Work with the selected rows
Tick the checkbox at the start of a row. The bar above the table shows how many rows are selected. Selected rows stay selected when you change page.

| Button | Needs | What it does |
|---|---|---|
| Open in Builder | Exactly 1 row | Opens the strategy as a flow in the Strategy Builder. |
| List on QuantsDepot | Exactly 1 row | See List on QuantsDepot. |
| Combine | 2 to 40 rows | See Combine strategies. |
| Export CSV, Export JSON | 1 or more rows | Saves the selected rows as strategy-miner-vault.csv or .json. The columns are id, symbol, timeframe, years, PF, drawdown, trades, robustness checks passed and total, net profit and created date. The strategy design is not in the file. |
| Delete | 1 or more rows | Asks “Delete n strategies from your vault?” and then removes them. |
Click a strategy’s number (such as #12) to open its detail card, with its own Open in Builder button. Clear selection unselects everything.
Where to go next
- Run another search: Quickstart.
- Combine selected strategies: Combine strategies.
- Tune one strategy’s numbers: Optimize parameters.
Metrics in the Vault come from an approximate backtest of past data. They do not guarantee future results.
Related reference: Metrics defines the Vault columns, and Limits gives the Vault size.