Prop-firm check Pro
Estimate how often a candidate's trades would pass a prop-firm challenge under published rules, and which rule it breaks when it fails.
This feature is part of Pro.
Prop check replays a candidate’s past trades against the rules of a prop-firm challenge many times, with the days reshuffled, and reports how often the replay passes. It is part of Pro. The calculation runs in your browser, in a background worker.
This is a probability estimate and does not guarantee a pass. Past results do not guarantee future results.
Run a check
- Open a candidate card in the results, or a strategy’s detail card in the Vault.
- Click Prop check.
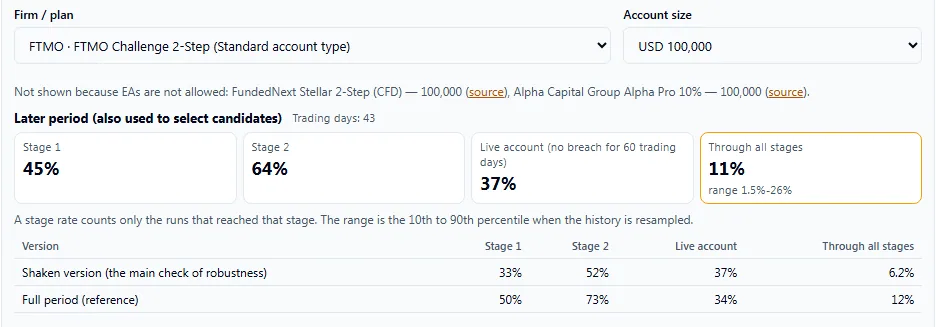
- Choose Firm / plan and Account size in the panel.
The check starts when you open the panel and again when you change the plan. The screen reads “Calculating… this runs in your browser and takes a few seconds.”
Firms and rules
The rules come from a preset file that was last checked on 2026-10-10. The panel lists that date and links the official pages under Rule sources (checked {date}). Rules change, so check the firm’s own page before you rely on a number.
| Setting | What it does | Values |
|---|---|---|
| Firm / plan | The challenge whose rules are applied. | FTMO · FTMO Challenge 2-Step (Standard account type), The5ers · High Stakes (2-Step) |
| Account size | The size of the chosen plan. | USD 100,000 |
Only plans that allow expert advisors in every phase are offered. Plans from FundedNext, Alpha Capital Group are not offered because their rules do not allow EAs. The panel lists them after “Not shown because EAs are not allowed”, with a link to the source.
How the estimate is made
- The Miner takes the candidate’s trades and groups them into days.
- Each of 2,000 trials rebuilds a history by drawing blocks of 5 days at random, then plays the challenge phases in order. After the last phase it plays a live account for 60 days.
- The check is repeated for a range of risk sizes, from 0.1% to 3% of the account per trade, to find the size with the highest pass rate.
- A shaken version of the trades is the main check of robustness. It drops 10% of the trades at random, and takes 25% of the entry bar’s price range off 15% of the rest. The unshaken full period is shown for reference.
Read the result
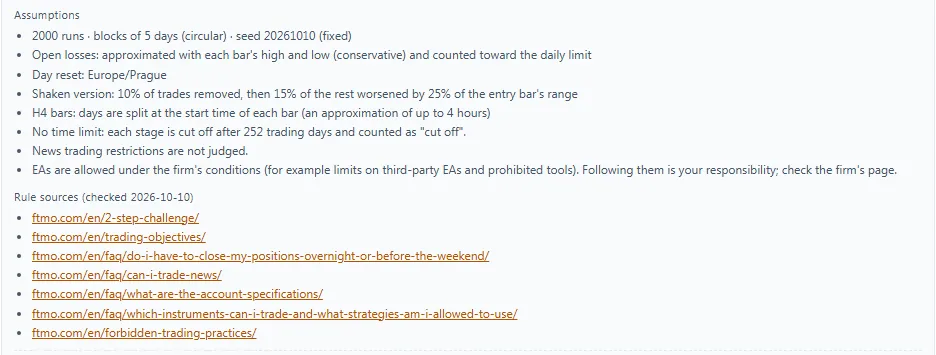
- Stage 1, Stage 2 (where the plan has one) and Live account each show a pass rate. Through all stages shows the pass rate for the whole path, with a range from the 10th to the 90th percentile.
- Shaken version (the main check of robustness) and Full period (reference) are the two rows to compare. A large gap means the result depends on the exact trades and fills of the past data.
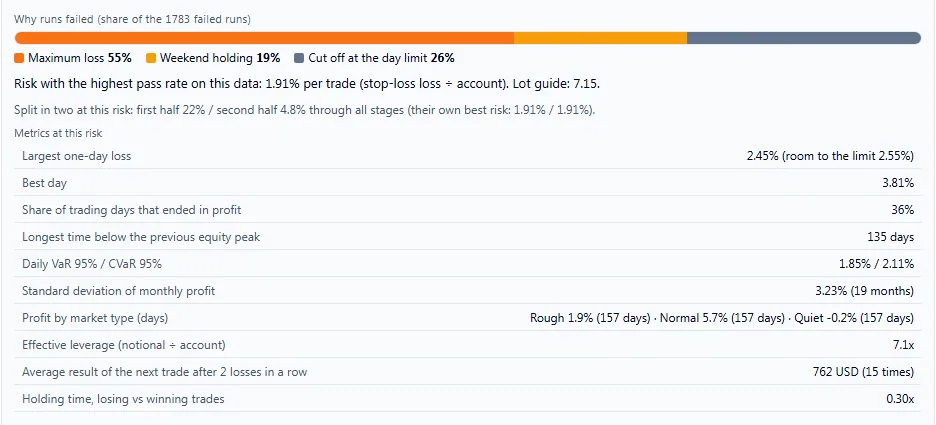
- Why runs failed counts the reasons: Daily loss, Maximum loss, Time limit, Consistency rule, Too few trading days, Too few profit days, Weekend holding, and Cut off at the day limit.
- Risk with the highest pass rate gives a percent per trade (stop-loss loss divided by the account), with a Lot guide. If the best risk is at the edge of the tested range, or the pass rate is 0% everywhere, the panel says so instead.
- A line splits the history in two halves and shows the pass rate of each half at this risk.
- A Metrics at this risk table lists the largest one-day loss, best day, profit-day share, longest time below the equity peak, daily VaR and CVaR at 95%, monthly standard deviation, profit by market type, effective leverage, and the holding time of losing versus winning trades.
- A result based on under 40 trading days carries the chip Reference value (under 40 trading days). Treat it as a rough guide.
- Assumptions lists what the model takes as given. Read it before you use the number.
Where to go next
- Tune the strategy: Optimize parameters.
- Look at several strategies together: Combine strategies.
Related reference: Metrics defines the figures, and Free tools lists the free prop report.