Optimize parameters Pro
Vary the numbers of one candidate, find a stable area instead of a single peak, and save the result as a new version in your Vault.
This feature is part of Pro.
Optimize parameters tries other values for the numbers inside one candidate, such as indicator periods, stop loss and take profit. It runs on your device, on the same price bars as the search. It is part of Pro. Without Pro the screen says “Optimization is part of Pro.”
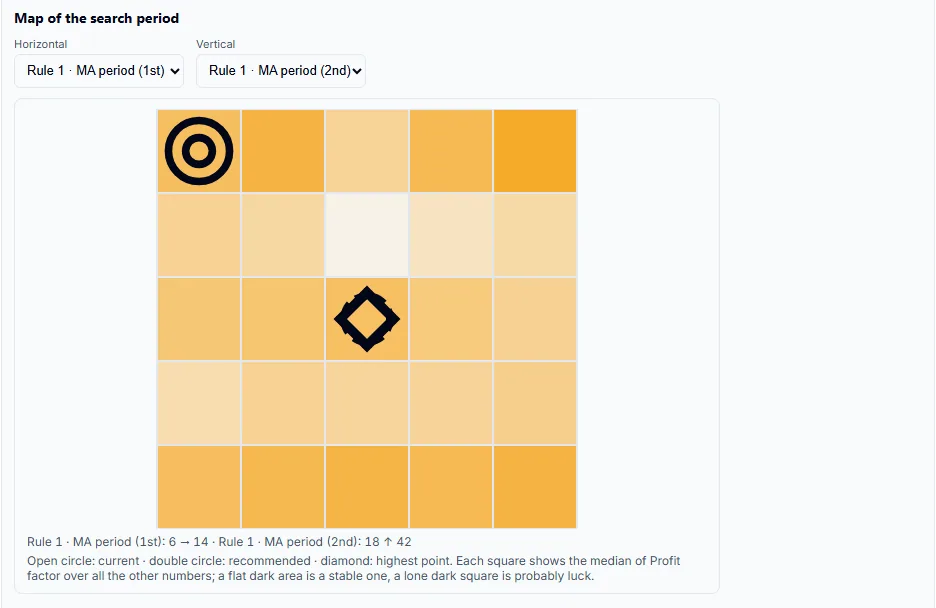
A single best point on a map of results is often luck. By default the Miner therefore recommends the middle of a stable area, where the neighbouring settings also did well, and shows the highest point next to it.
Start an optimization
- Open a candidate card in the results, or a strategy’s detail card in the Vault.
- Click Optimize parameters.
- Choose which numbers to vary (next section) and the options below.
- Click Run optimization. A progress line reads “Tried n of about m on this device…”. Click Stop to end the run early.
Choose the numbers to vary
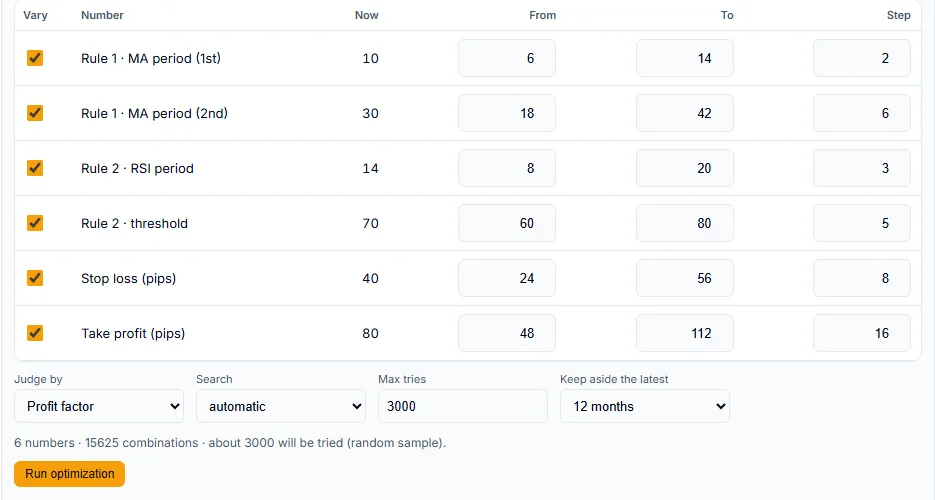
The setup table has one row per number, with the columns Vary, Number, Now, From, To and Step. Rows include Stop loss (pips), Take profit (pips), and the numbers of each rule, labelled “Rule n · …”.
- Tick Vary for the numbers to search. You can vary up to 8 numbers at once.
- From, To and Step start at two steps either side of Now. A step is 20% of the current value (at least 1). Level numbers use a step of 5, and deviation numbers 0.25.
- A line under the table reads “n numbers · m combinations · about k will be tried (method).” Use it to check the size before you run.
Set the search
| Setting | What it does | Values |
|---|---|---|
| Judge by | The score each combination is ranked on. | Balanced score, Profit factor, Return / drawdown, Net profit |
| Search | How combinations are picked. | automatic, all combinations, random sample, genetic search |
| Max tries | The most combinations to test. | 10 to 20,000, default 3,000 |
| Keep aside the latest | A recent stretch that is not used to choose, only to check the choice. | 12, 6 or 24 months, or None |
automatic tests every combination when their number fits in Max tries, and a random sample otherwise. The line under the table names the method it will use.
Read the result
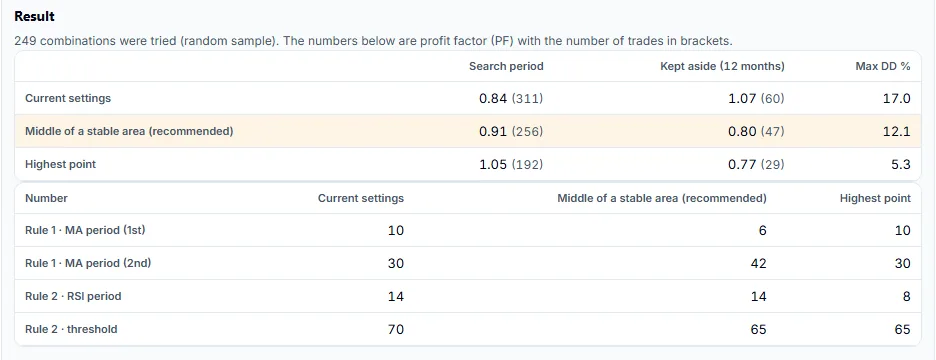
A table compares three versions of the strategy.
| Row | Meaning |
|---|---|
| Current settings | The strategy as it was. |
| Middle of a stable area (recommended) | The point whose neighbours also scored well. |
| Highest point | The single highest score. |
The columns show the result on the Search period, on the period Kept aside, and the Max DD %. A version needs enough trades to be considered: at least 20, or 60% of the original trade count if that is larger. A second table lists the value of each number in the three versions.
- Map of the search period shows scores for two numbers at a time. Pick them with Horizontal and Vertical. An open circle marks the current settings, a double circle the recommended point, and a diamond the highest point.
- If the recommended point does well on the search period but badly on the part kept aside, treat the result as overfitted.
Check it with a walk-forward test
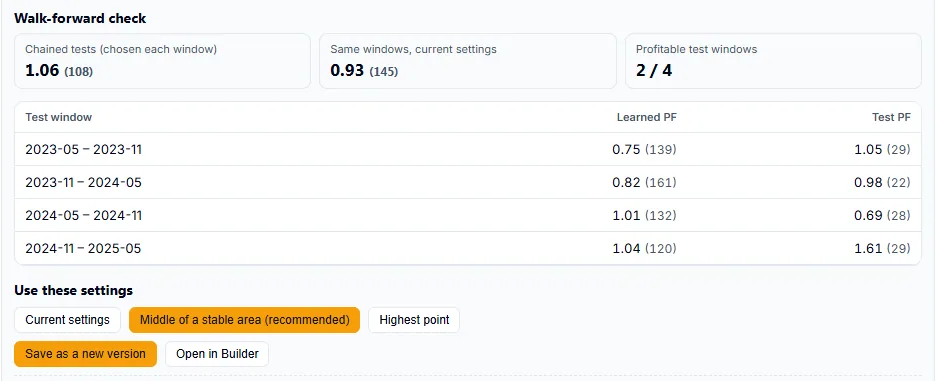
Click Show walk-forward. The Miner re-chooses the settings on the previous 24 months, tests them on the next 6, and repeats along the history. It shows Chained tests (chosen each window), Same windows, current settings and Profitable test windows. Use it to see whether choosing by optimization beat leaving the settings alone.
Use the result
- Choose one of the three versions with Use these settings.
- Click Save as a new version to add it to your Vault. It is not available for Current settings. If the new settings give the same trades as a row already there, the Miner says so instead of saving a copy.
- Or click Open in Builder to continue in the Strategy Builder.
The other-symbol checks and the robustness re-check are not repeated for new numbers. Treat a new version as not checked on those points. You can run the Prop-firm check on it.
Optimizing on past data fits the numbers to that data. The result does not guarantee future results.
Related reference: Metrics defines the figures in the result.