Risk management for an expert advisor comes down to one decision made before you attach it: how large a position, against how much deposit, and at what point you stop. The EA will not make that decision. It will keep trading its rule through the worst stretch in its record and through whatever comes after.
Four numbers do the work, and only one of them is usually quoted:
- The worst trough, in money. Not the percentage — the amount the balance actually gave back.
- The worst losing run. Median 8 trades across these records. Worst: 38 in a row.
- The worst single trade, which sits a median of 1.89× the average loss and up to 10.2× it.
- The floating-equity gap. The open-position drawdown was deeper than the closed-trade one in all 23 records.
The first three are measured below from the 23 closed-trade lists. The equity gap comes from each run’s balance and equity drawdown figures.
| Test conditions | |
|---|---|
| Experiment ID | EXP-EA-RISK-BUDGET-001 |
| Source | Closed-trade lists of 23 MT5 Strategy Tester runs |
| Population | 23 EA backtest records, every one with its full closed-trade list |
| Model | MetaTrader 5 Strategy Tester backtests |
| Deposit | 10,000 on all 23 |
| Last verified | 2026-08-25 |
How we run and label these tests is set out in our testing methodology.
What to look for: the four numbers that set your size
Read them off the EA’s own report and trade list before you decide anything. MT5 prints most of them, but not in the form you need for sizing.
| Number | Why it sets your size | Where the report misleads |
|---|---|---|
| Worst trough in money | It is the amount your deposit has to absorb without you intervening | The percent beside it is measured from the peak balance, not from your deposit |
| Worst losing run | It is how many times in a row you have to not intervene | Maximum consecutive losses is printed, but easy to skip past the ratios |
| Worst single loss | One trade can cost 10× the average one | The average loss sits beside it and looks like the safer input |
| Floating-equity gap | Your margin lives on equity, not on closed trades | The balance line is the flattering one |
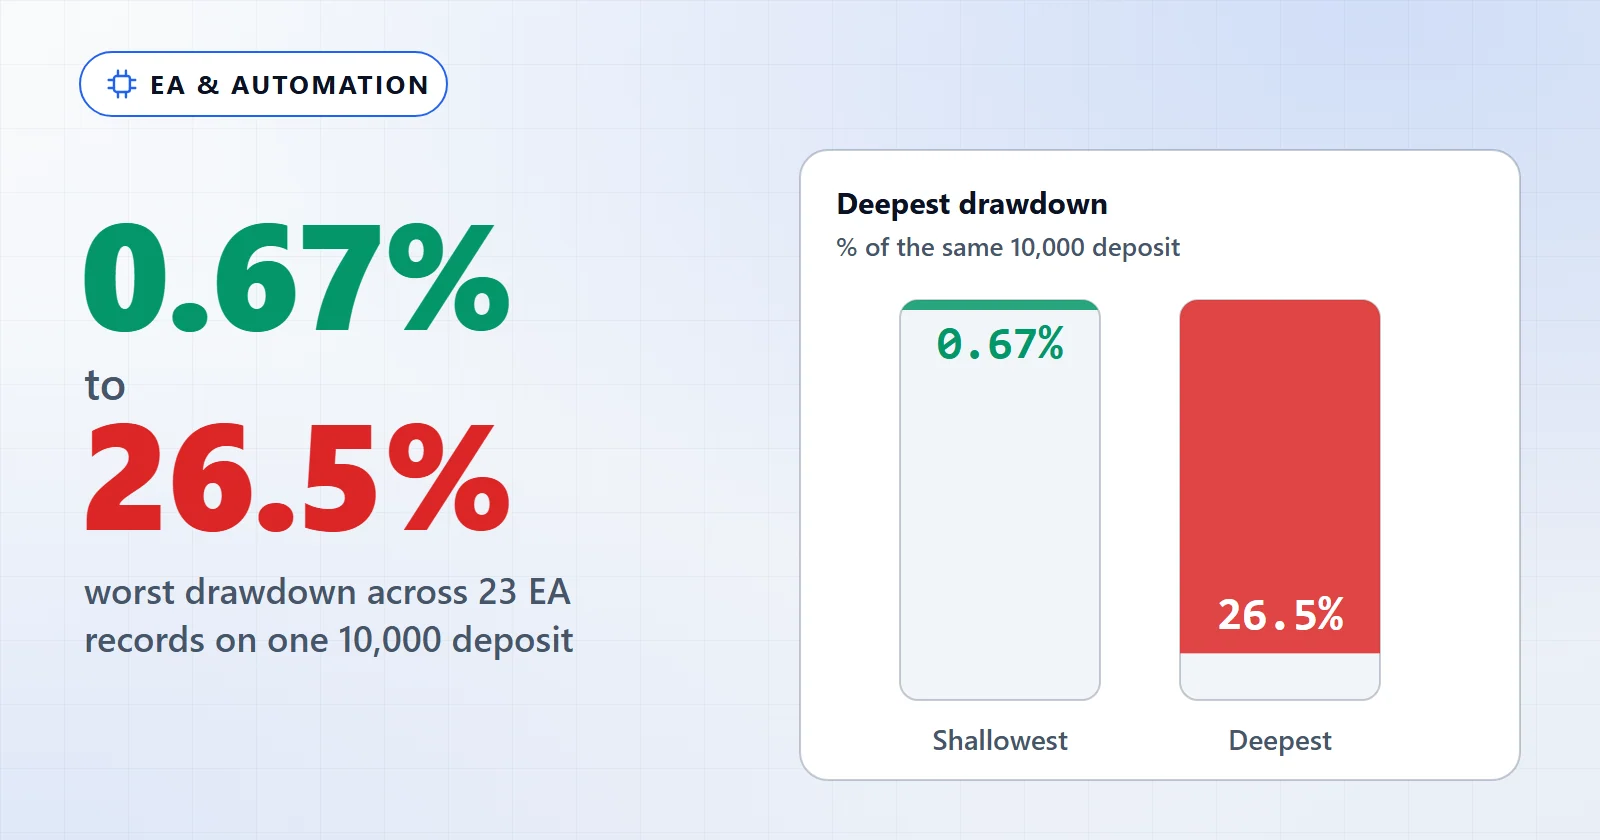
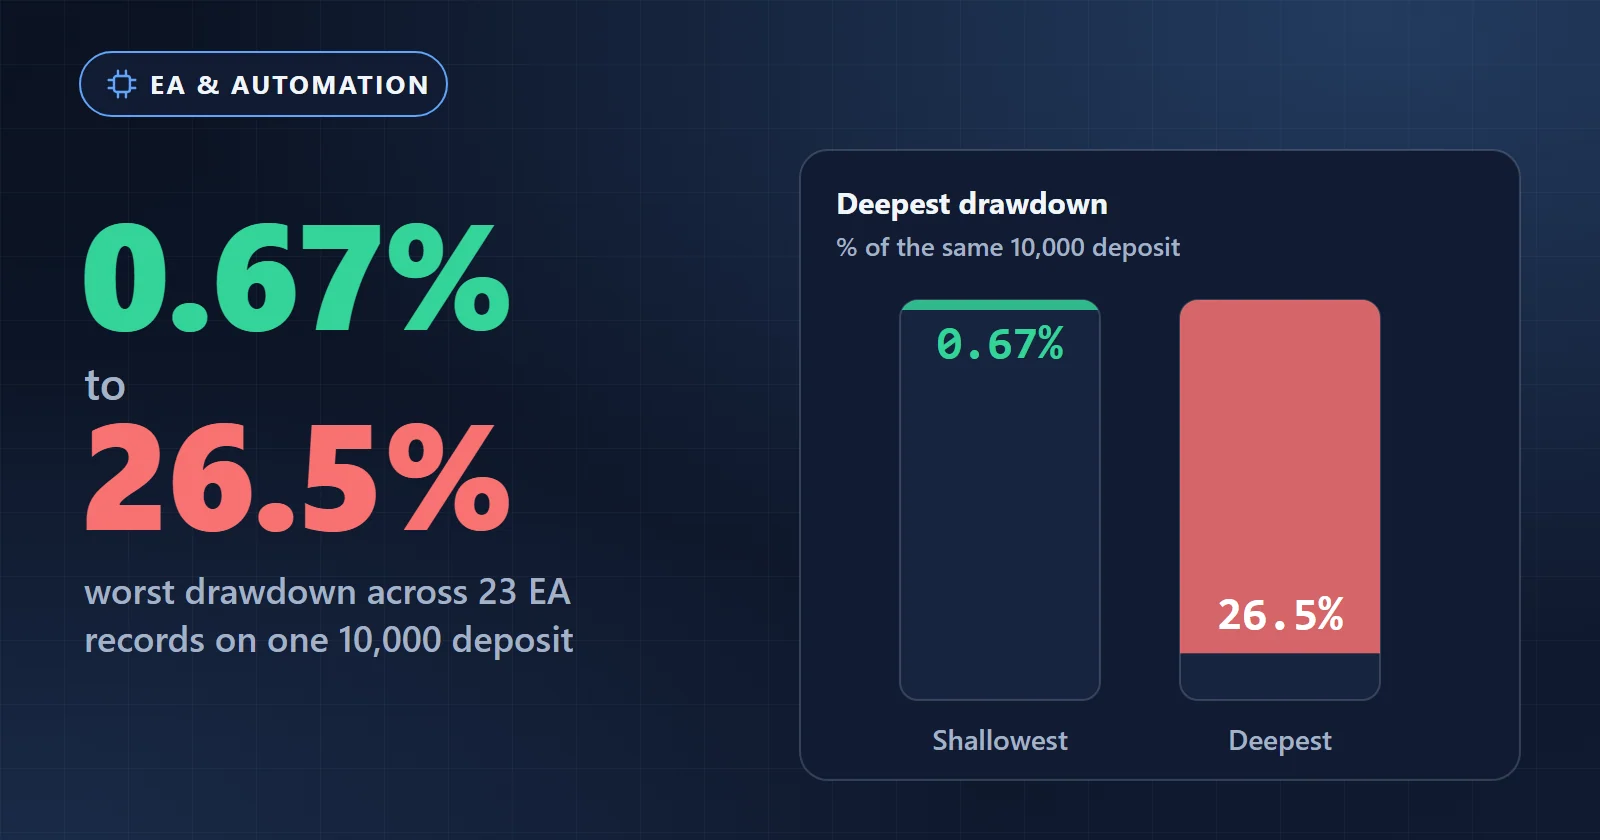
The spread across the records is the reason this matters. The deepest, the shallowest and a few in between, by worst trough:
| Main symbol | Trades | Worst trough | Share of the 10,000 deposit | Worst losing run |
|---|---|---|---|---|
| GBP/JPY | 695 | 2,649.54 | 26.50% | 35 |
| EUR/USD (4 symbols) | 4,725 | 2,479.13 | 24.79% | 14 |
| EUR/JPY | 776 | 2,464.64 | 24.65% | 38 |
| EUR/GBP | 426 | 1,359.02 | 13.59% | 9 |
| EUR/USD (5 symbols) | 912 | 965.88 | 9.66% | 8 |
| USD/JPY | 1,611 | 575.34 | 5.75% | 10 |
| JP225 | 210 | 67.43 | 0.67% | 4 |
Median across all 23: 8.67%. So the typical record gives back roughly a twelfth of the deposit at some point — and the deepest gives back more than a quarter. All but the JP225 record ran at 0.1 lots on the same deposit. The spread comes from the rule set and the market it trades, not from the size.
Check the record was produced at the size you will run
One more check, and it takes ten seconds: a trough figure only applies to you if you run the EA at the size it was measured at.
Of the 23 records, all 23 ran on a 10,000 deposit and 22 used 0.1 lots. The exception is the JP225 record, produced at 3.0 lots rather than 0.1, on an index instrument. Its 0.67% trough is the trough of the 3.0-lot run. Run it at 0.1 lots and you are running a position its record does not describe. Open the Inputs tab of the report or the .set file, and confirm the lot size before you borrow any percentage from it.
Fixed lots vs percent risk vs sizing from the record
Three approaches, and the one most articles recommend is the one that fits an EA worst.
| Approach | What it does | Where it breaks with an EA |
|---|---|---|
| Fixed lots | One size, never changes | Safe and honest, but the size is arbitrary unless you derived it from a trough |
| Percent risk per trade | Size scales to a stop-loss distance | Assumes a fixed stop. Many EAs exit on a condition, not a price, so “1% per trade” has nothing to attach to |
| Sizing from the record’s worst trough | Pick a size where the worst observed trough is money you can sit through | Needs the trade list, and gives you a bigger number than you wanted |
The middle row is the trap. Position sizing by percent-of-account is sound advice for a discretionary trader who sets a stop on every entry. An EA that manages its exit dynamically does not give you the distance the formula needs. Substituting the average loss understates the tail badly: across these records the worst trade is a median of 1.89× the average one. The extreme is a five-symbol record whose worst single trade cost 545.00 against an average loss of 53.43, 10.2 times larger.
The third row produces uncomfortable numbers, which is the point. If the GBP/JPY record’s worst trough is 26.5% of a 10,000 account at 0.1 lots, then running it on 5,000 at the same size means the same sequence takes 53% — and no plan survives being half wrong before it is right.
Running the plan in practice
- Open the EA’s trade list or saved Strategy Tester report and read its worst trough in money, its worst losing run and its worst single loss — not the summary line.
- Double the worst trough. The record bounds what has happened, not what will. Six of these 23 records exceed a quarter of the 10,000 deposit once you double them; one exceeds half.
- Set your deposit so that doubled figure is money you can watch disappear without switching the EA off. If it is not, halve the lot size rather than hoping.
- Add the floating-equity margin. Every one of the 23 records has a deeper open-position drawdown than its closed-trade one — a median of 1.08× and up to 1.76× worse — because the balance only moves when a trade closes.
- Write down two stop conditions in numbers before you enable Algo Trading: a money figure that ends the test, and a number of consecutive losses that ends it. Decide them while you have nothing at stake.
Step 4 is the one people skip. The trough figures on this page come from a closed-trade equity curve, and a closed-trade curve is blind between entries. The account that receives a margin call is looking at floating equity, which in these same records runs deeper in every single case. Treat the trough figures here as a floor.
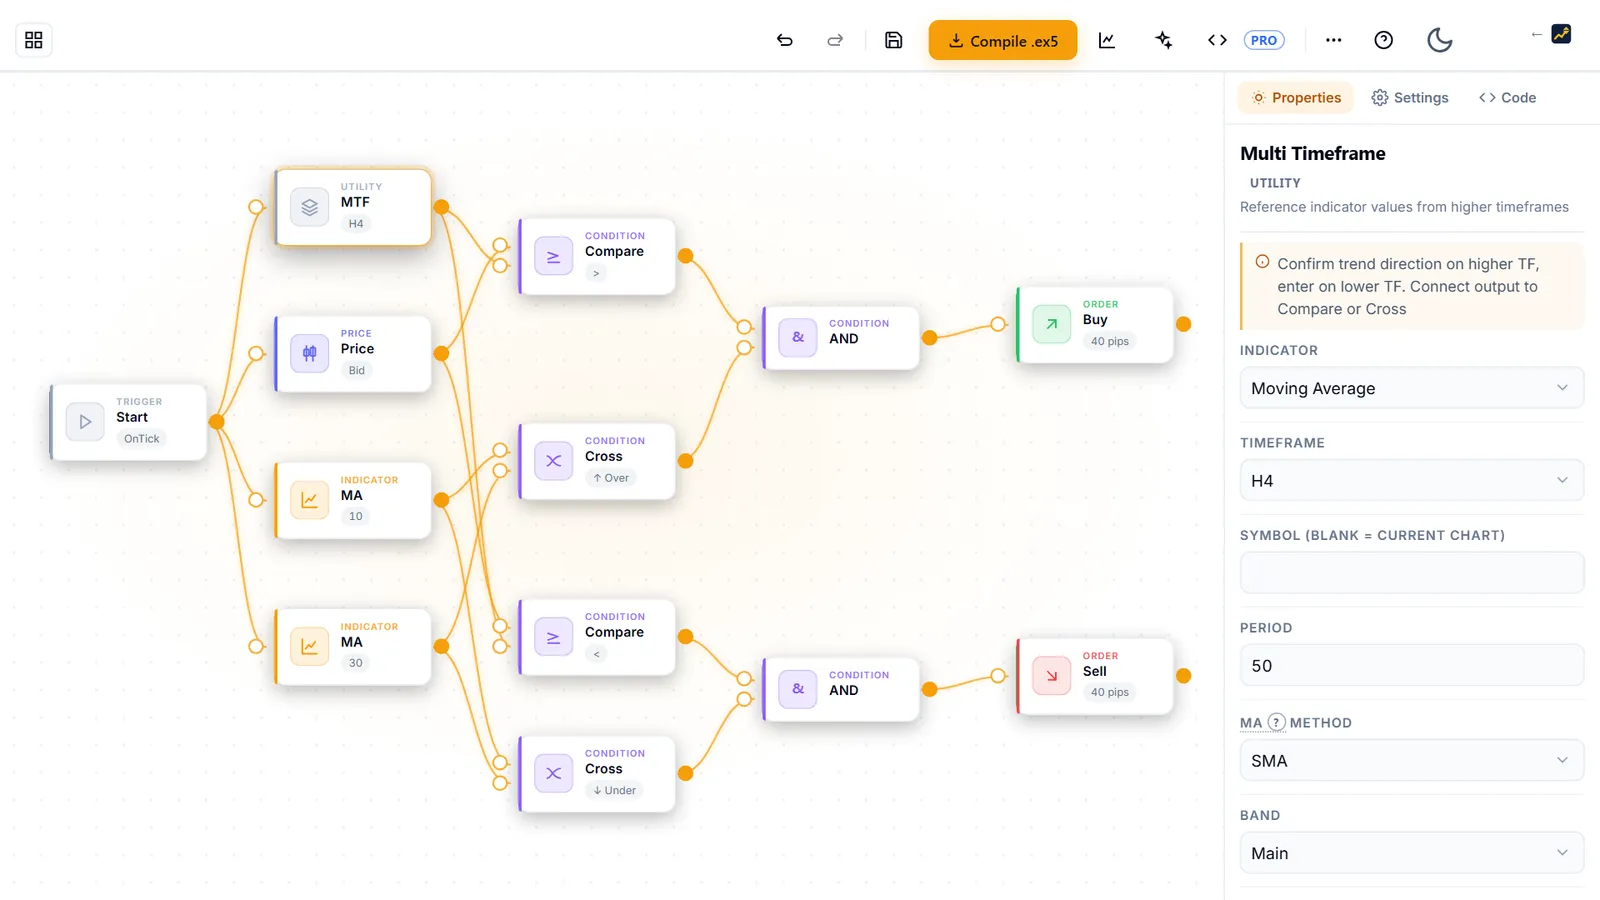
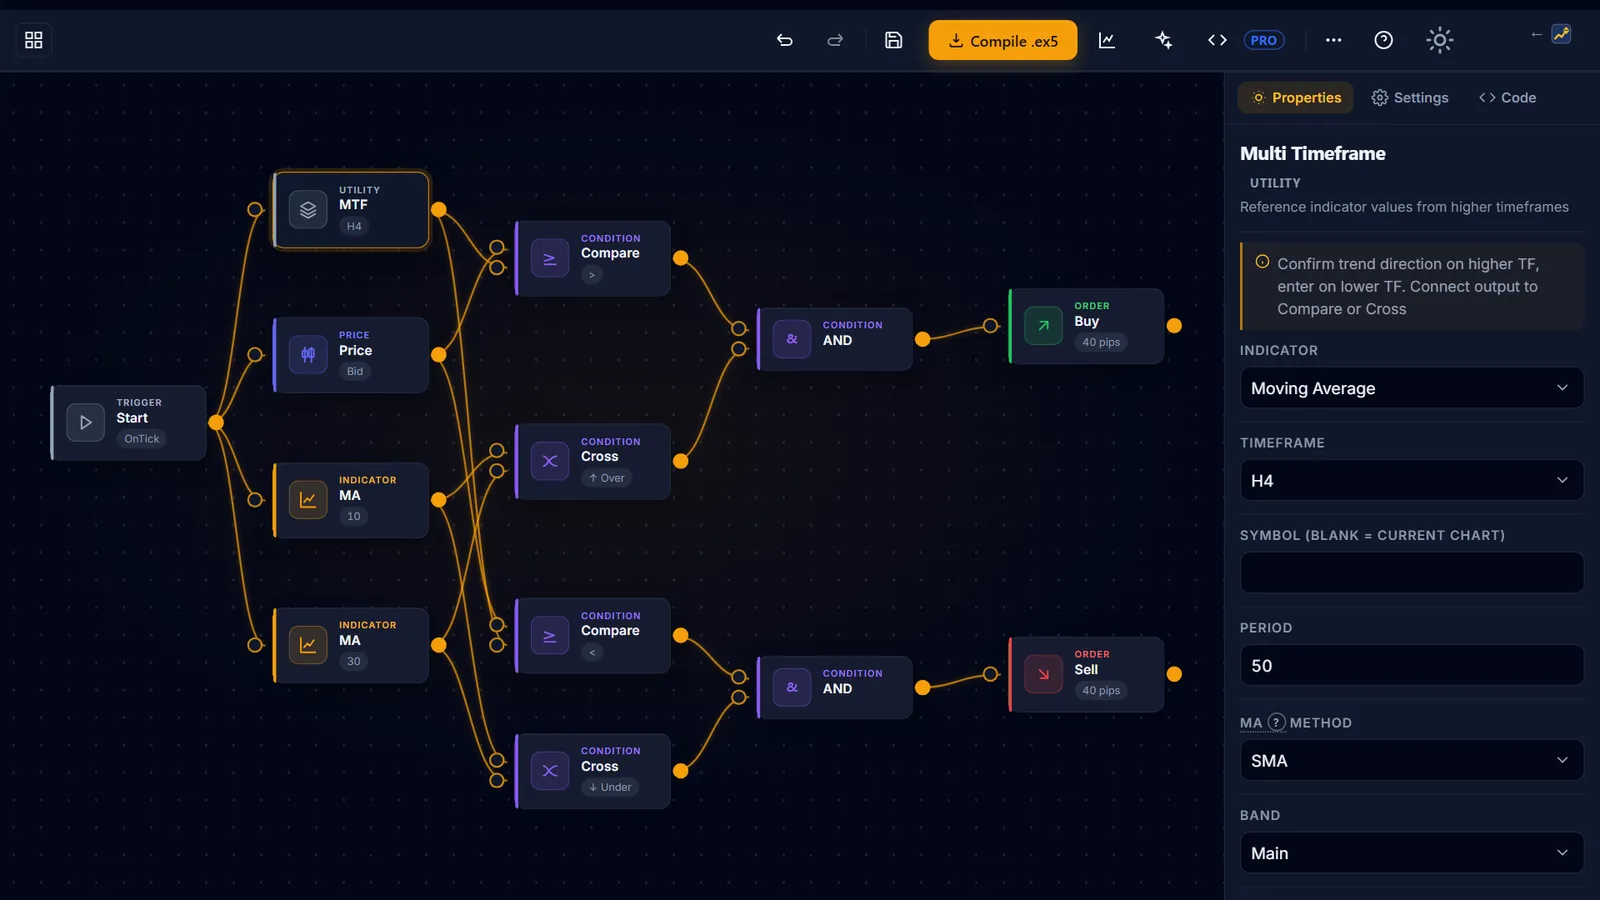
If you build the EA yourself, you can bake the sizing in rather than remembering it. In the Strategy Builder, lot size and the money rules live in the Settings tab, not on the canvas. Set a fixed lot you derived from the trough, and confirm that martingale lot, averaging and pyramiding are off before you compile.
The losing run matters more than the drawdown depth
A trough that recovers and relapses is survivable in a way that an uninterrupted one is not, because each winning trade in between gives you a reason to keep going. The EUR/JPY record is the case worth studying: its worst losing run is 38 trades, and the money lost in that run — 2,464.64 — is exactly its whole worst trough. Every one of those 38 trades lost. Nothing interrupted it.
That is 38 consecutive opportunities to conclude the EA is broken, at a point in the record where the correct answer was to do nothing. Compare the four-symbol EUR/USD record, which reached a similar trough of 2,479.13 with a worst run of 14 — a materially easier thing to sit through for the same money.
Risk, and the numbers that mean stop
Four failure modes, in the order they actually occur.
Sizing to the average. The average loss across these records is 0.66% of the 10,000 deposit at the median, which sounds like a comfortable 150 losing trades of runway. The worst single trade reaches 5.45% of the deposit. An account sized on the average meets the tail with roughly an eighth of the buffer it assumed.
Intervening inside the drawdown. This is the expensive one, and the numbers above are the reason it happens: 38 losses in a row is long enough for any explanation to become plausible. The defence is not willpower. It is deciding the exit number in advance and sizing small enough that the number does not arrive early.
Running several EAs on one account and adding the troughs. Every figure above describes one EA measured alone. Nothing in these records says two of them cannot be under water in the same week, and the naive assumption — that diversifying shrinks the drawdown — is the one worth testing before you rely on it. The measurement we have of combining rules comes from the Strategy Builder’s template gallery: all 9 portfolio templates ended with a median drawdown of -3.51% against -1.065% for single rules, and one three-rule composition in EXP-MACD-RECIPE-BASELINE-001 reached a drawdown 3.76 times deeper than its MACD rule run alone while its profit factor moved by 0.02. Size a multi-EA account against the sum of the individual troughs until you have measured your own combination, not against the average of them.
Treating the backtest as the worst case. It is the best-documented case, not the worst. None of these records is a live-account run, and a backtest never tests execution, slippage or a broker outage. Doubling the trough is not pessimism. It is the minimum correction for measuring the future with a ruler built from the past.
Nothing here is financial advice, and no past drawdown bounds a future one.
Next steps
From there:
- To see what 53 measured designs say about returns rather than sizing, are Expert Advisors profitable reads what “profitable” turns out to mean.
- If the EA you are sizing came from somewhere else, how to use a free EA covers the checks that come before this one — starting with whether anyone independent measured the numbers at all.
- To produce a trough figure for a rule of your own, run a backtest and read the closed-trade list rather than the summary line.