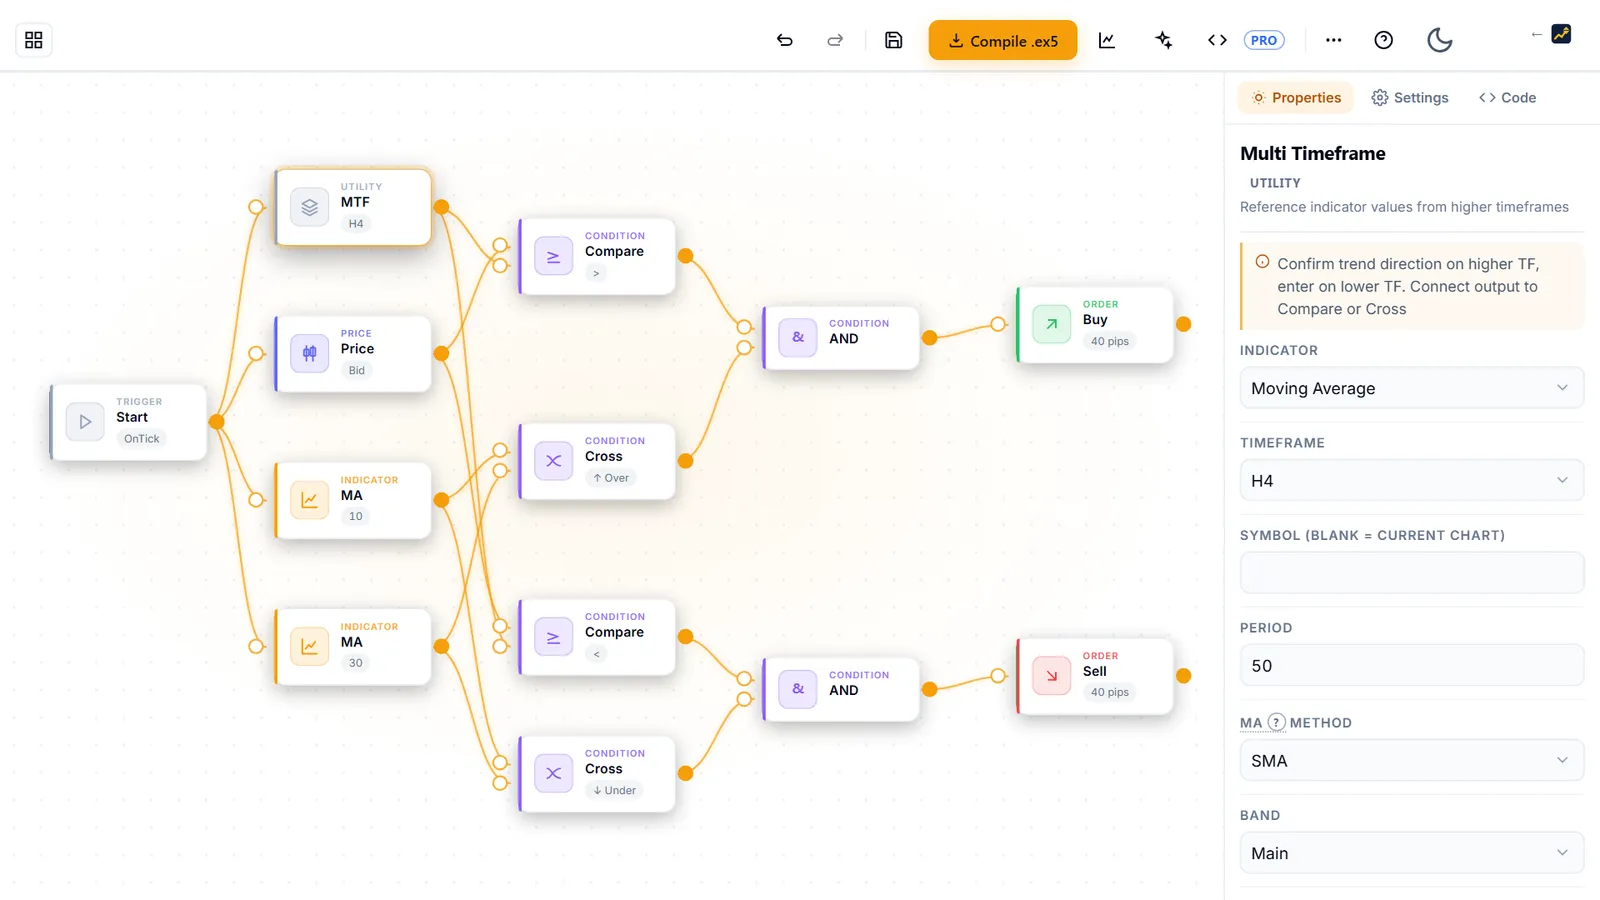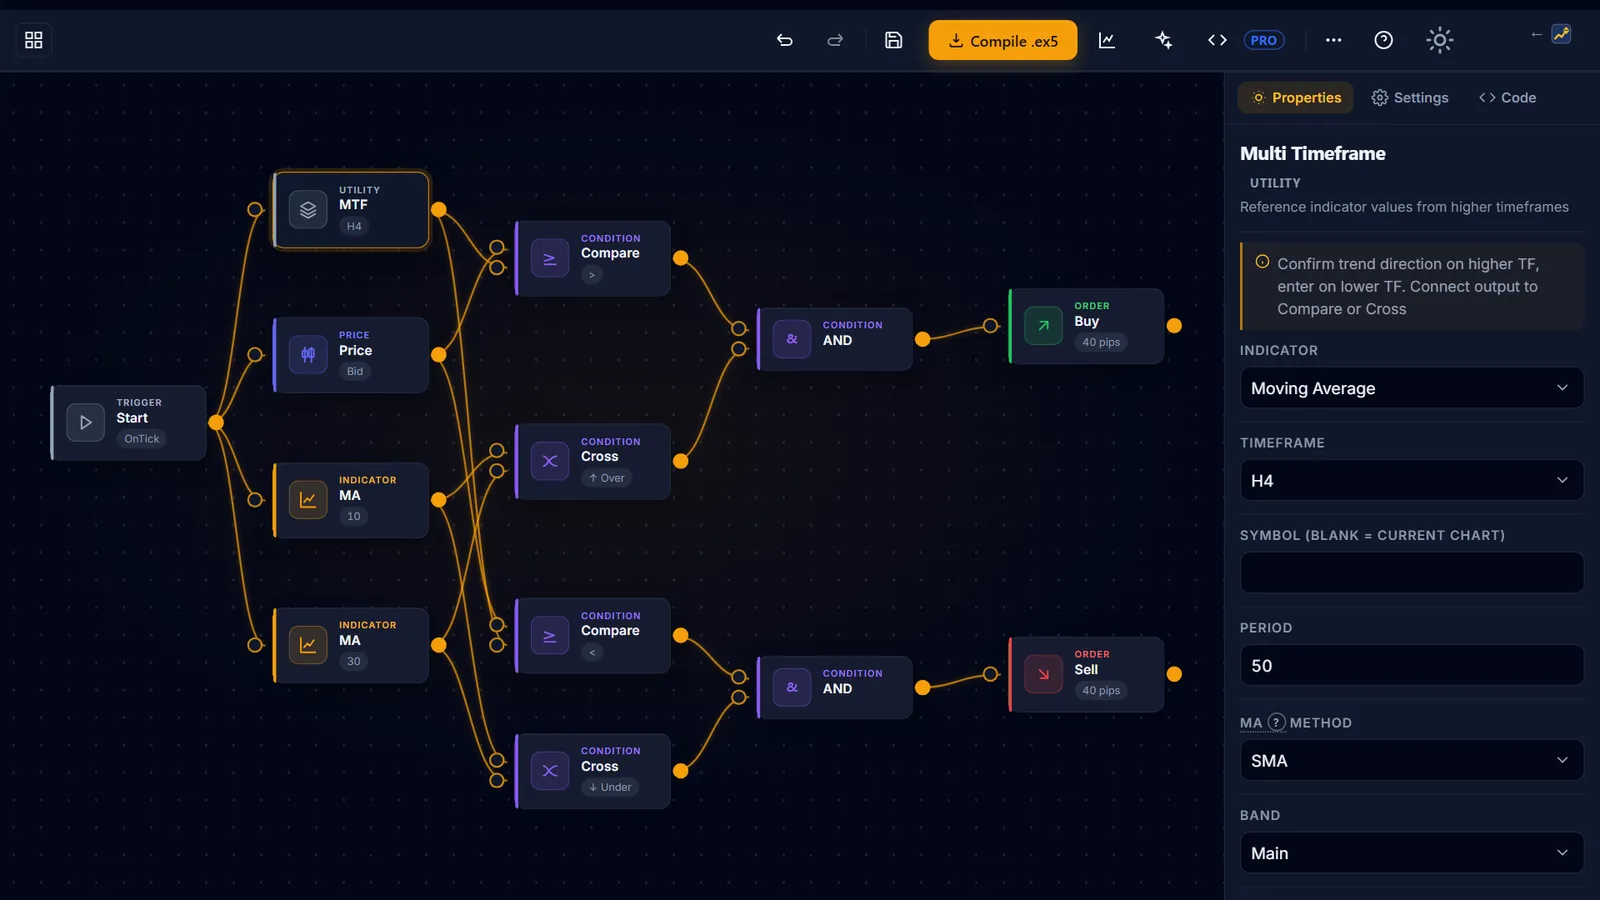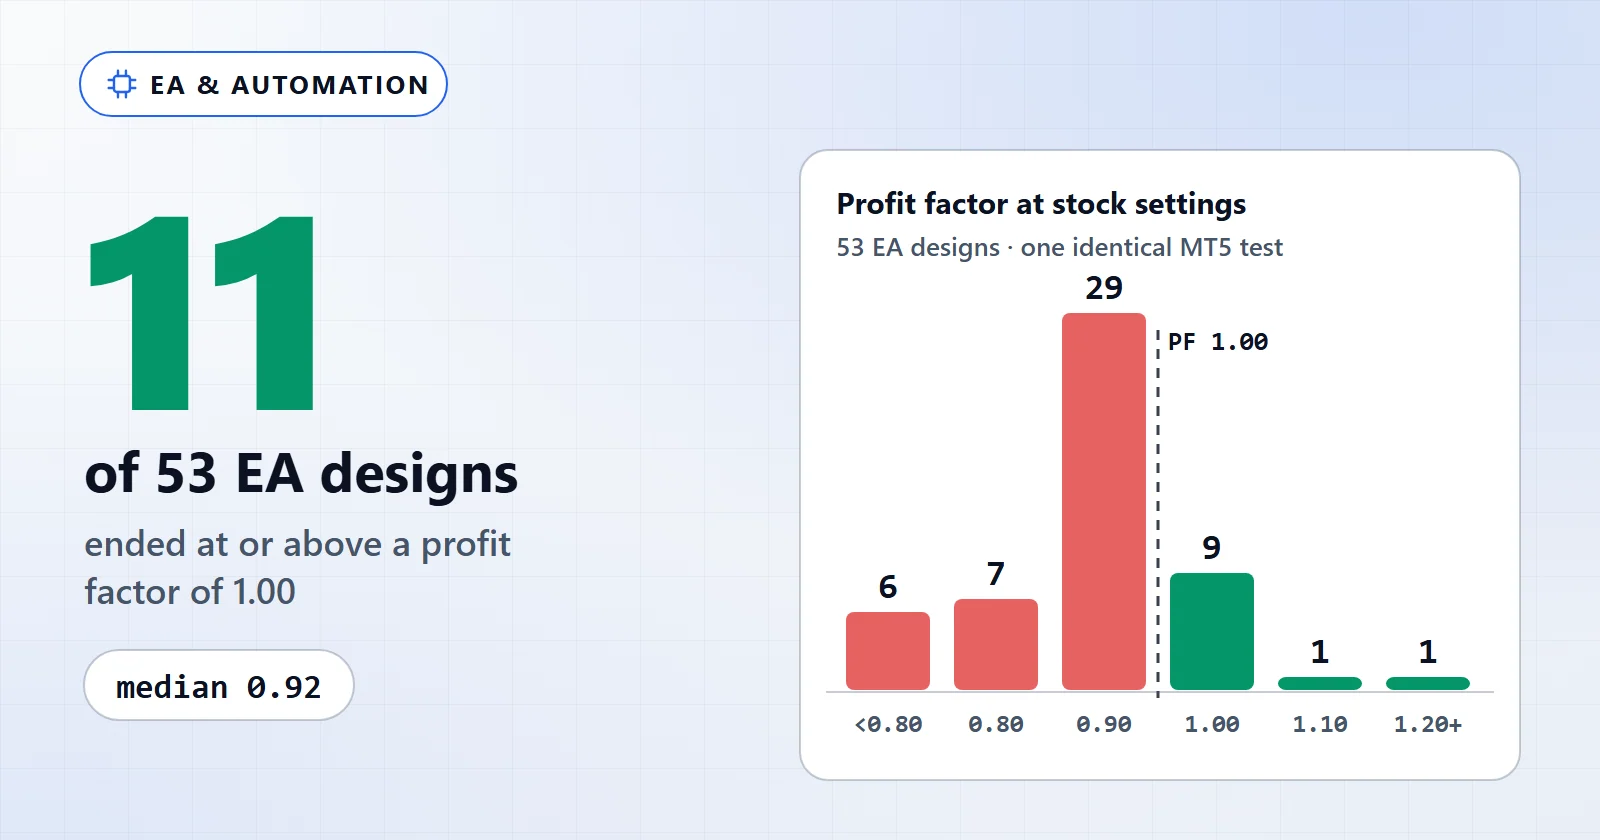
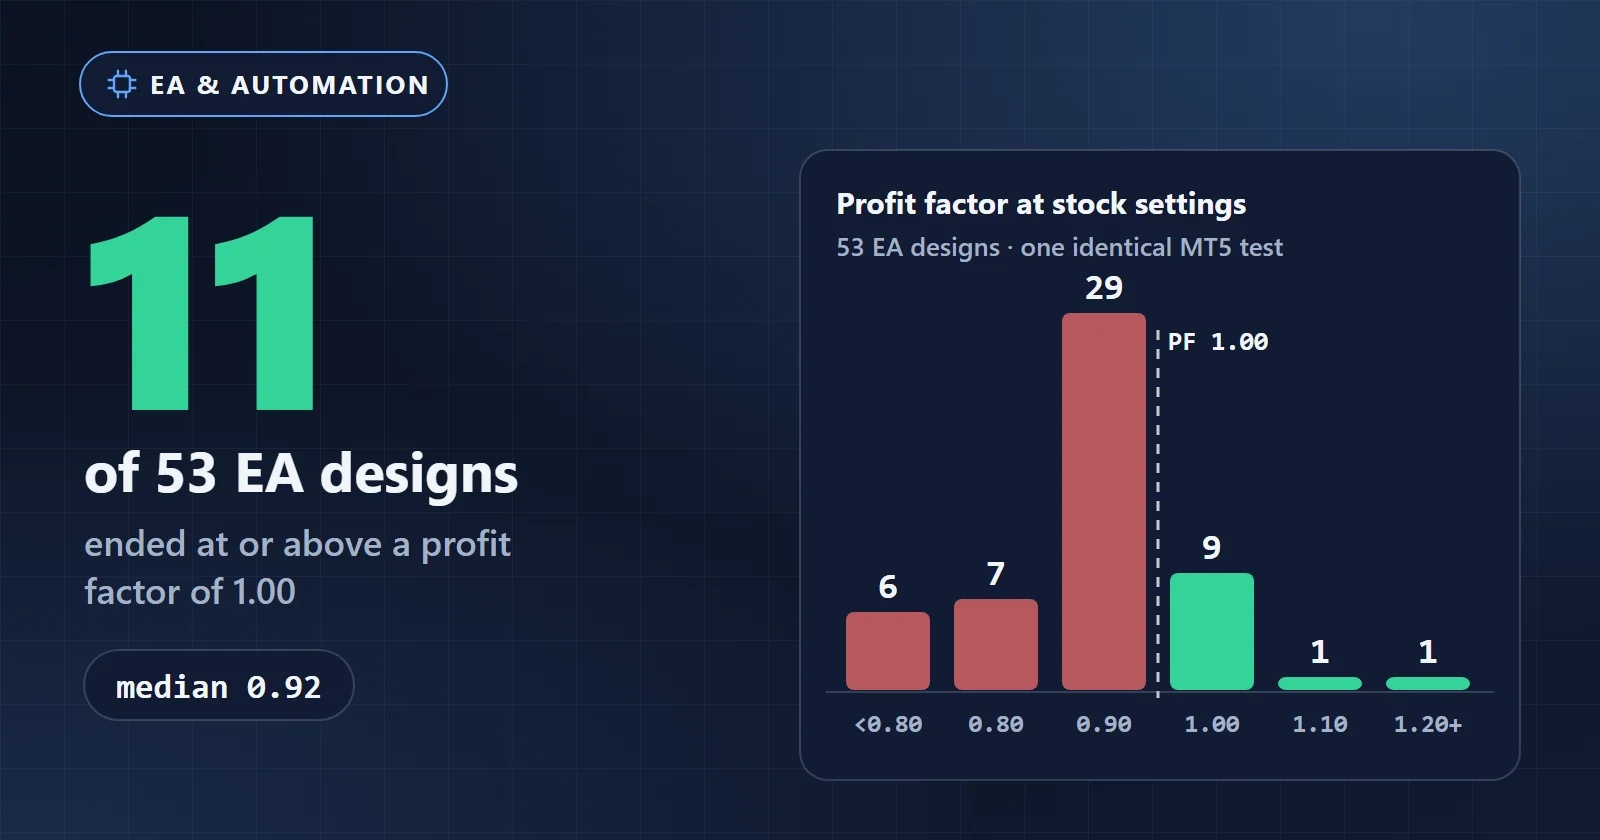
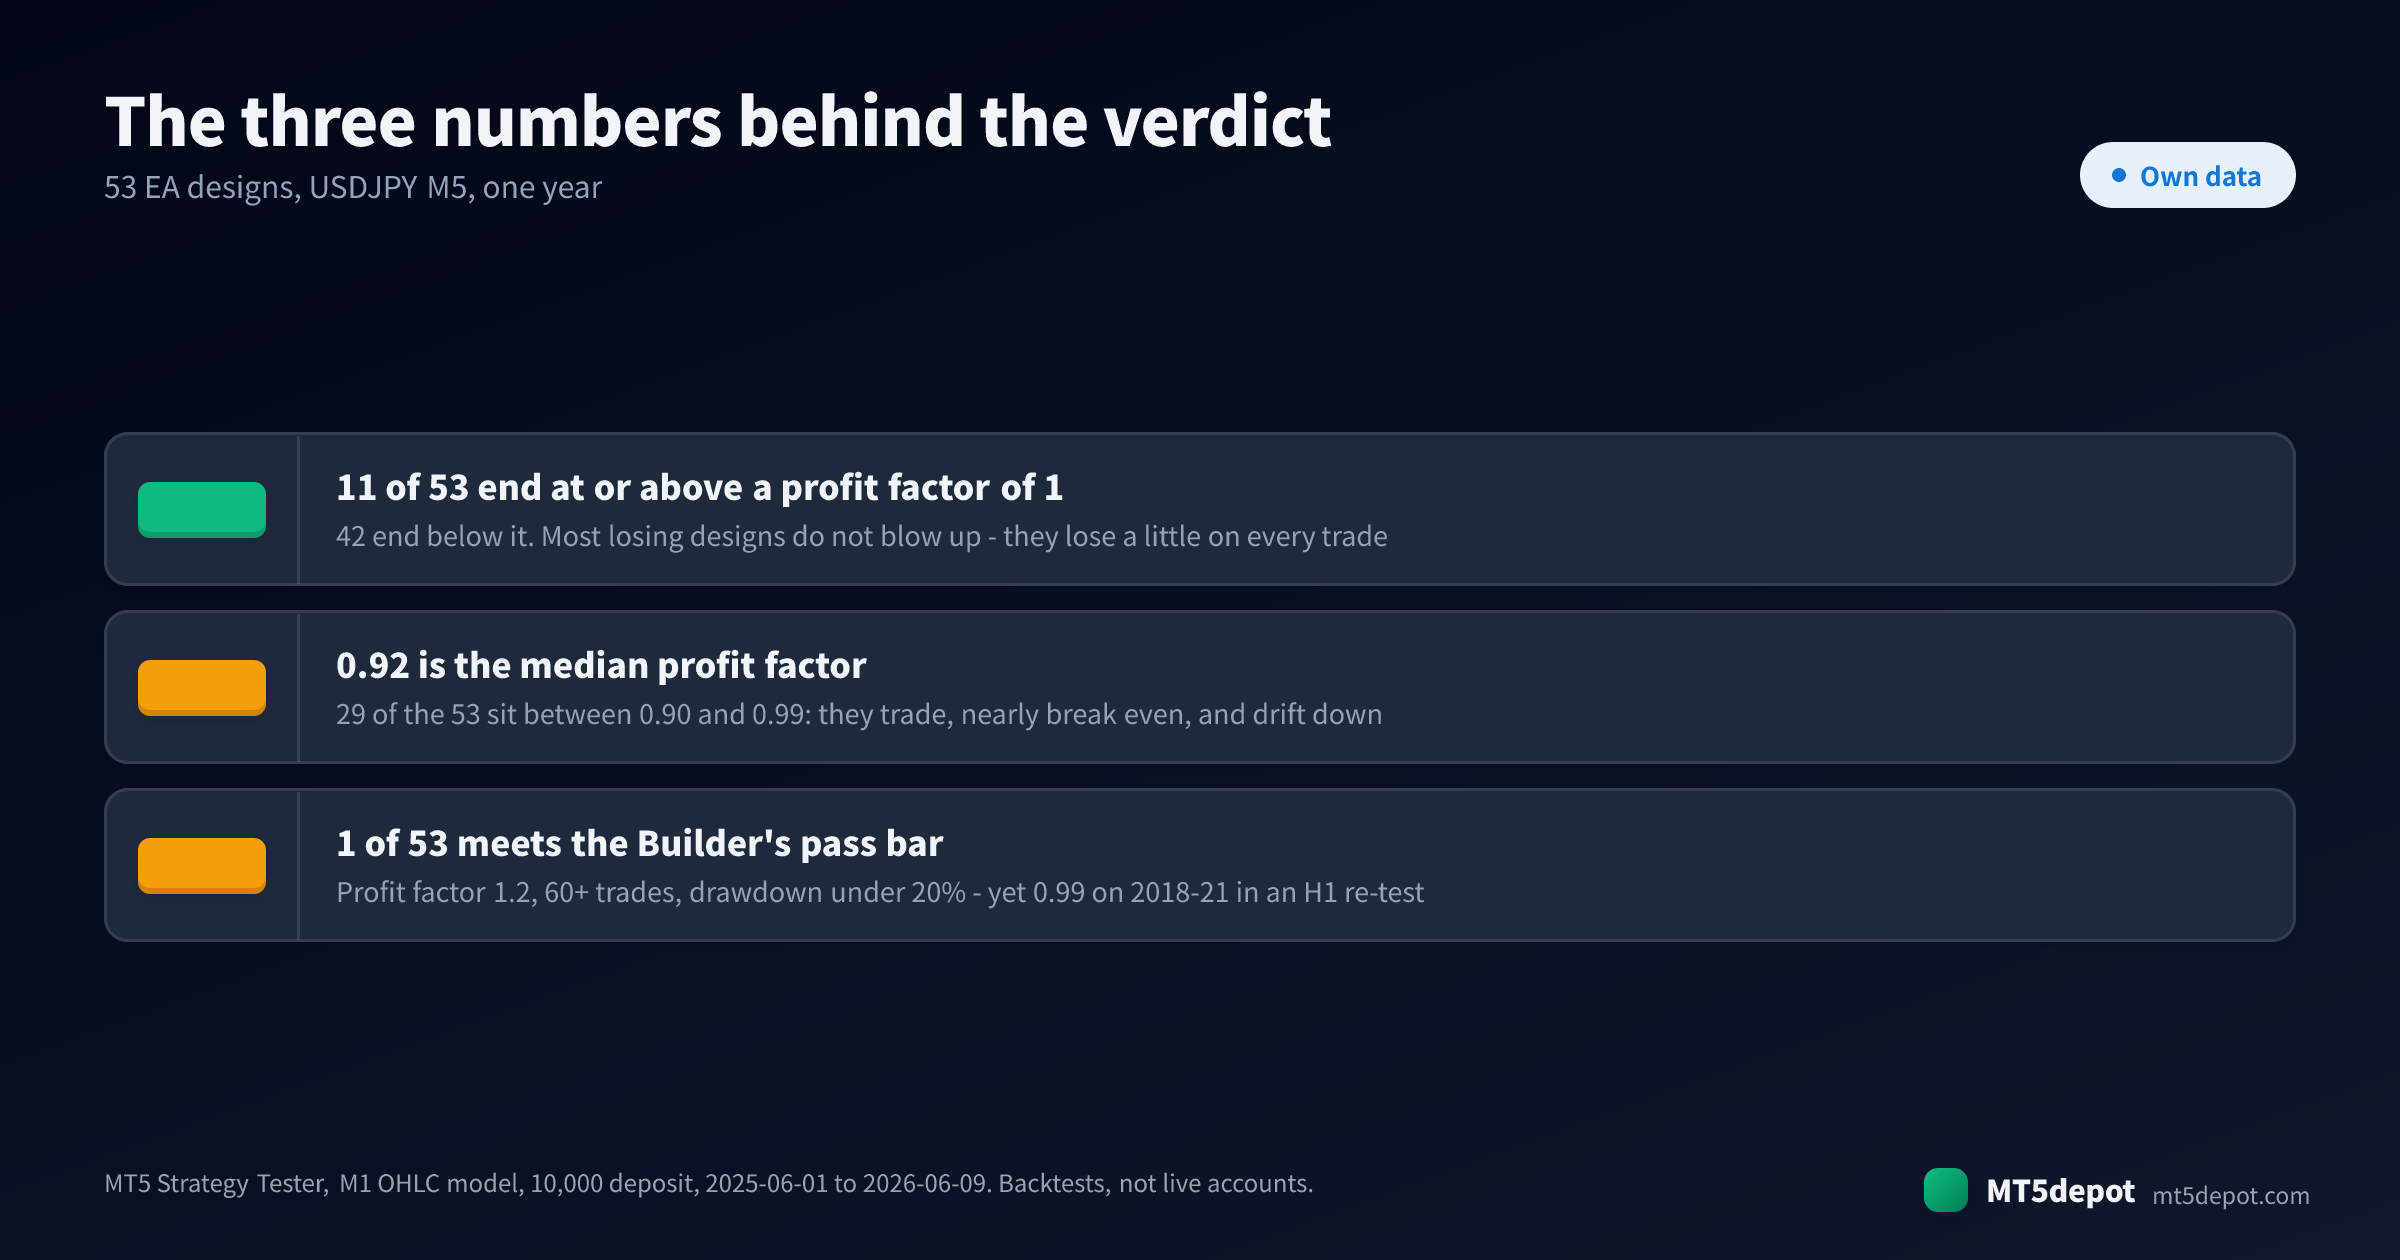
Some are, most are not, and the ones that are tend to be modest. We ran the 53 measured expert advisor designs in the AIStrategyMiner Builder gallery through one identical MT5 test. 11 ended at or above a profit factor of 1.00, 42 ended below it, and the median was 0.92. One design met the thresholds the Builder uses to pass a build. Profitability belongs to a specific rule on a specific market over a specific window, after costs. It is not a property of “EAs”.
But it depends on:
- The rule, not the label. 29 of the 53 designs ended between 0.90 and 0.99. They trade, they nearly break even, and they lose slowly.
- The window you measure. The best design in the set scored 1.23 on the tested year. In a separate H1 re-test, the same stock setting scored 0.99 on 2018–21.
- How the settings were chosen. Eight recorded parameter searches reached in-sample profit factors up to 1.37. None produced a setting that held on the windows it was not fitted to.
- The risk taken for the result. The largest net profit in the set, +304.23, came from a grid basket that went through a -7.92% drawdown to earn it.
- Backtest versus live. Every figure here is a Strategy Tester run. None is a live account.
Each of those is tested against our own data below.
What the data shows: 53 EA designs, one identical MT5 test
The Builder ships 87 starter templates, and 53 of them carry a measured backtest. All 53 were run once, under the same symbol, timeframe, period, model and deposit. That matters more than it sounds. Most published comparisons of EAs mix brokers, periods and account sizes, so the differences between them are mostly differences between tests. Here the only variable is the rule set. How we run and label these tests is set out in our testing methodology.
| Profit factor at stock settings | Designs |
|---|---|
| Below 0.80 | 6 |
| 0.80 to 0.89 | 7 |
| 0.90 to 0.99 | 29 |
| 1.00 to 1.09 | 9 |
| 1.10 to 1.19 | 1 |
| 1.20 and above | 1 |
| Test conditions | |
|---|---|
| Experiment ID | EXP-TEMPLATE-PROFITABILITY-001 |
| Parent experiment | EXP-BUILDER-TEMPLATE-BASELINE-001 |
| MT5 build | Not recorded in the template manifest |
| Environment | MetaTrader 5 Strategy Tester, Exness MT5, measured 2026-06-18 |
| Symbol / timeframe | USDJPYm M5 |
| Period | 2025-06-01 – 2026-06-09 |
| Model | M1 OHLC (Model=1) |
| Deposit | 10,000 |
| Last verified | 2026-09-27 |
The shape of that distribution is the first finding. Losing EAs are not usually spectacular. 29 of the 53 sit between 0.90 and 0.99, and the median drawdown across all 53 is only -1.33%. A rule with no edge does not blow up; it pays a little on every trade and drifts down. That is why a losing EA can run for months before anyone decides it is losing.
The top of the table is short, and it is worth reading closely:
| Design | Blocks | Trades | Profit factor | Max drawdown | Net on 10,000 |
|---|---|---|---|---|---|
pending_breakout | 9 | 164 | 1.23 | -0.21% | +38.47 |
ma_distance_pullback | 6 | 159 | 1.10 | -0.26% | +25.55 |
mtf_sar_bb_break | 21 | 20 | 1.08 | -0.10% | +3.27 |
basket_avg_tp_grid | 7 | 8,765 | 1.03 | -7.92% | +304.23 |
dualpair_rsi_basket | 13 | 12,953 | 0.87 | -36.38% | -3,433.95 |
The best design made +38.47 on 10,000 over a year, under 0.4%. The third rests on 20 trades, which is a rumour rather than a result. The grid basket made the most money in the set and needed a drawdown larger than its profit to do it. And the worst design lost a third of the account running the same test. “Profitable” covers all of the first four rows, and they are not the same kind of result.
Two limits sit on top of the table before any of it means anything. It is one symbol, one timeframe and one year — enough to say a design is not finished at stock settings, not enough to rank strategies in general. And the M1 OHLC model interpolates the path inside each bar, so the absolute figures carry the usual fill-price caveat (modelling quality explains why).
Comparison: what separates profitable EA designs from the rest
If profit is rare, the useful question is what the profitable ones share. We sorted the same 53 records by the traits people usually credit.
| Group | Designs | Median profit factor | At or above 1.00 | Median drawdown |
|---|---|---|---|---|
| Single strategy, 4–8 blocks | 14 | 0.945 | 4 | -1.025% |
| Single strategy, 9–12 blocks | 18 | 0.93 | 3 | -1.165% |
| Single strategy, 13+ blocks | 12 | 0.94 | 4 | -1.035% |
| Portfolio of several rules | 9 | 0.91 | 0 | -3.51% |
| Any design with a drawdown beyond 5% | 8 | — | 1 | — |
Complexity did not help. The three size groups land within 0.015 of each other, and the best design in the set uses nine blocks. Adding filters to a rule changes which trades it takes. It does not, on this evidence, change whether the rule has an edge.
Combining rules made it worse. All nine portfolio templates ended between 0.89 and 0.95, none at or above 1.00. Their median drawdown was -3.51% against -1.065% for single rules. Several rules reading the same price tend to agree and lose together. Diversification spreads a positive expectancy; it does not create one.
Size and leverage amplified the outcome, not the edge. Eight designs went more than 5% under water. One of them, the grid basket, finished above 1.00, at 1.03. The rest include the worst two results in the set, both near -36%. A grid or a leveraged lot rule does not turn a weak signal into a strong one. It turns a small loss per trade into a large one, or postpones it.
“Recommended” is a statement about wiring. The gallery marks 40 of the 53 measured designs as recommended, and 10 of those 40 ended at or above 1.00. The flag says the flow is a clean example of its pattern. It was never a claim about profit.
Profitable in one window versus profitable across three
The comparison that matters most is not between designs. It is between windows, and eight of the templates carry a recorded parameter search that shows it directly. Each search moved the stop loss and take profit on H1 across up to three windows — the period it was fitted on, a hold-out after it and an earlier one — and records the figures it kept. Where a cell is empty, the record does not carry that number.
| Design | Stock PF | Best in-sample | Hold-out | Earlier window | Verdict |
|---|---|---|---|---|---|
ichimoku | 1.03 | 1.37 | 0.89 | 0.80 | no_robust_edge |
ma_crossover (H1) | 0.95 | 1.23 | — | 0.98 | no_robust_edge |
cci_level | 0.95 | 1.07 | 1.05 | 0.92 | no_robust_edge |
adx_trend | 0.96 | 1.04 | 0.91 | 0.80 | no_robust_edge |
breakout | 1.05 | 1.04 | 0.79–0.89 | 0.64–0.84 | no_robust_edge |
rsi_reversal | 0.94 | 0.91 | — | — | no_robust_edge |
bb_bounce | 0.97 | 0.91 | — | — | no_robust_edge |
macd_signal | 0.93 | — | 1.14–1.15 | 0.74–0.77 | no_robust_edge |
The biggest in-sample number fell the furthest: ichimoku’s 1.37 became 0.89 and 0.80. macd_signal reached 1.14–1.15 on the hold-out and 0.74–0.77 on the earlier window. Two designs never cleared 1.0 even on the data they were fitted to. This is overfitting in its ordinary, well-intentioned form: the setting that fits one window best is the one that has absorbed the most of that window’s noise.
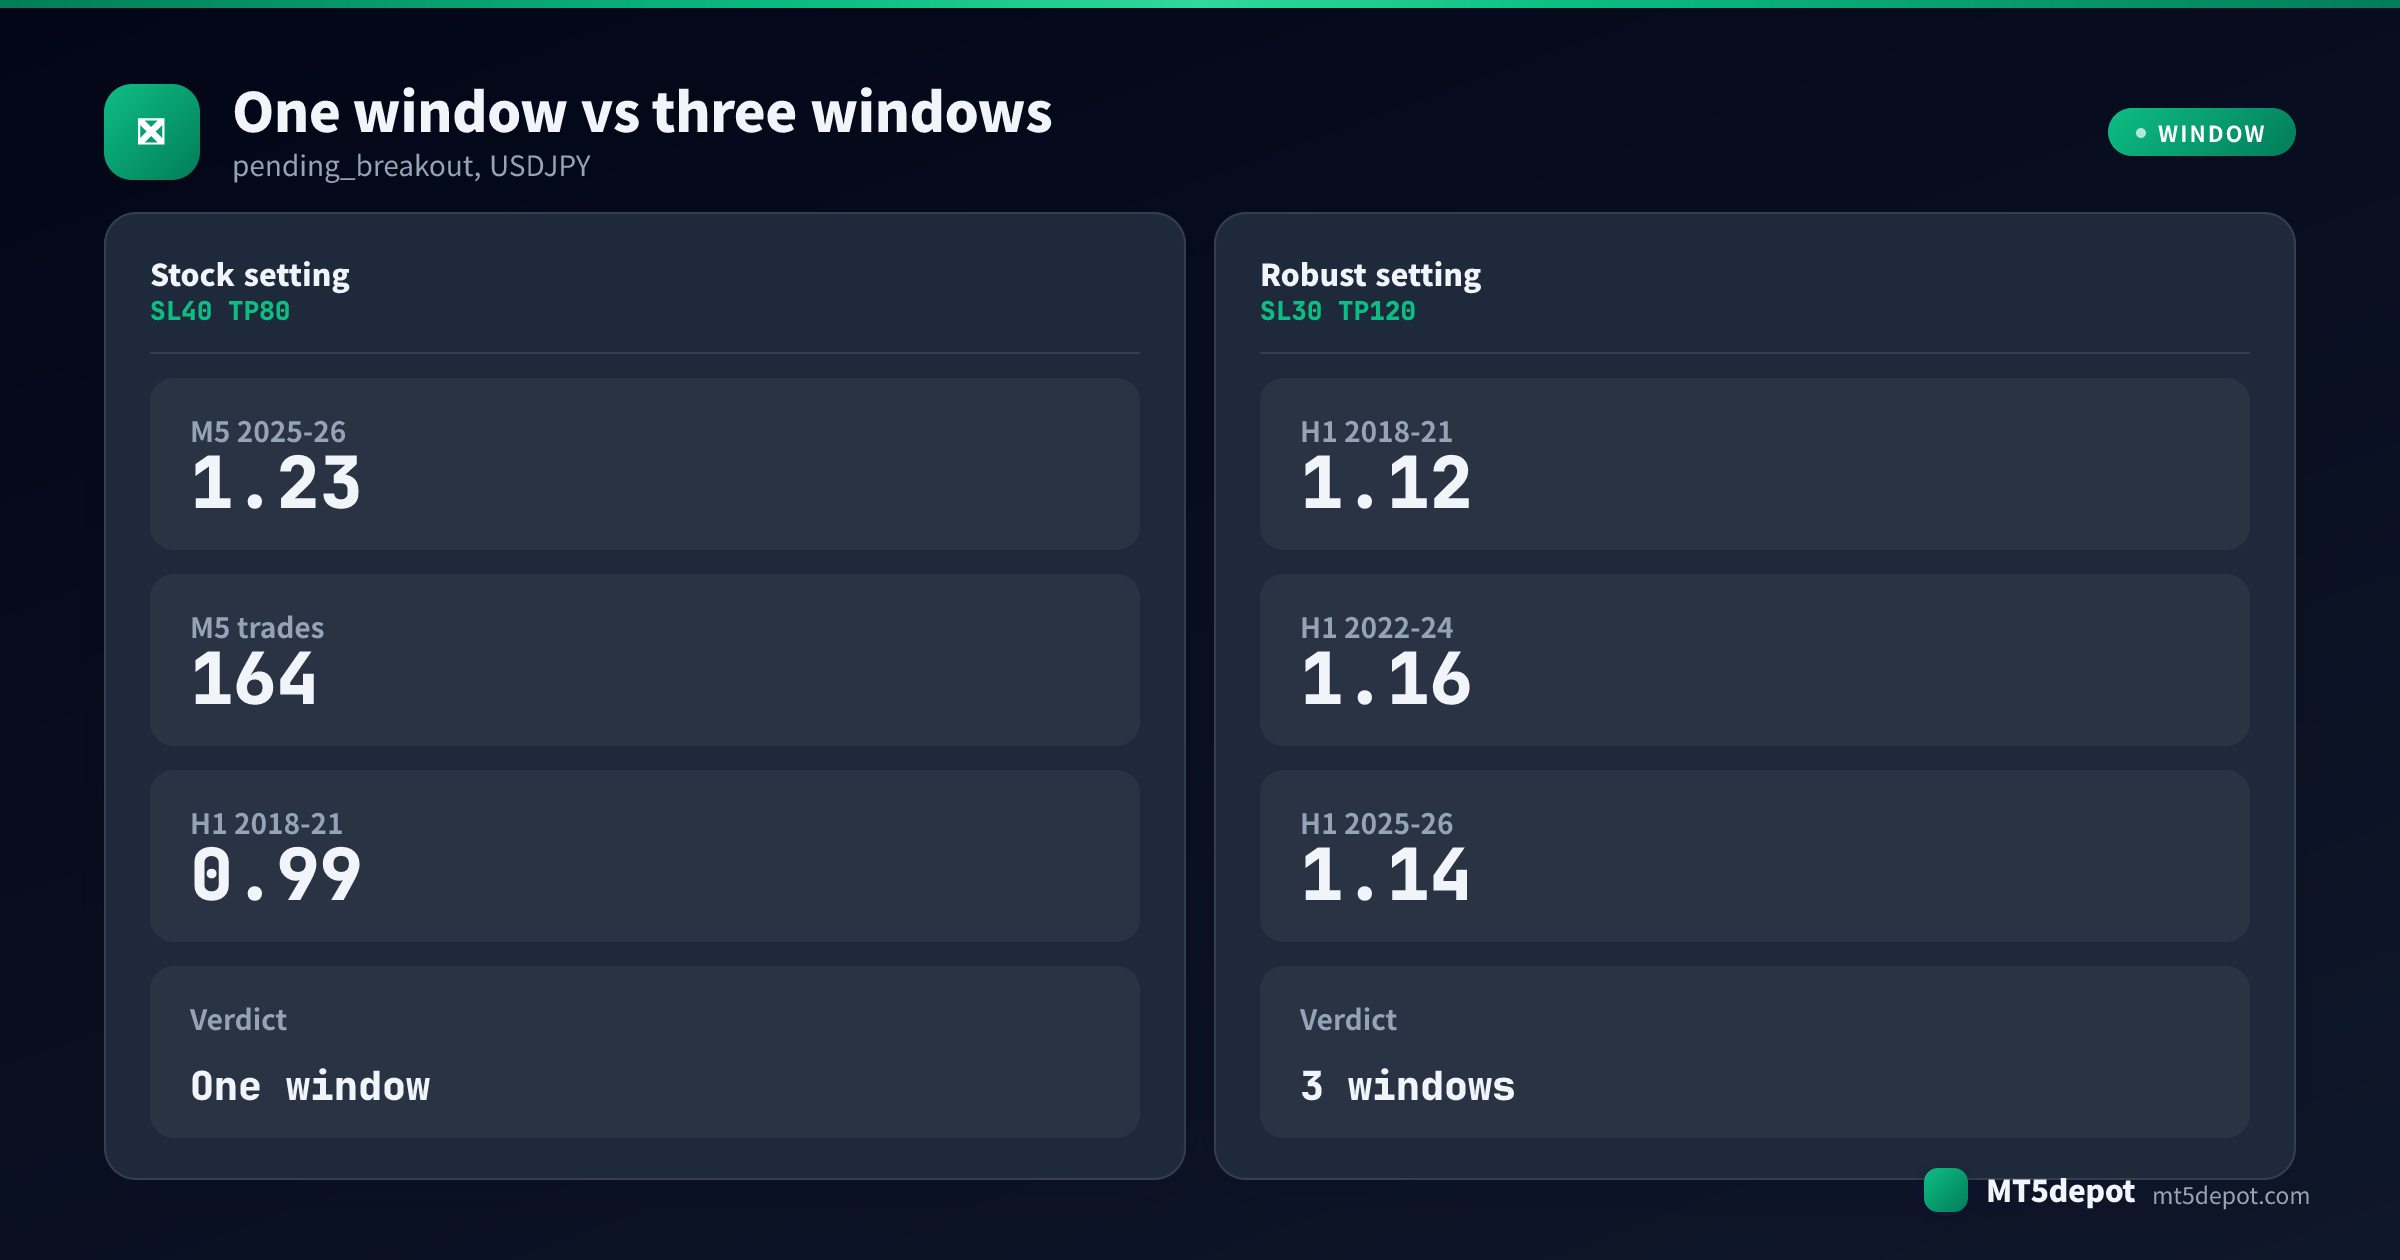
The one design with a clean three-window record is the best one on the table above. Its 1.23 comes from the M5 test. pending_breakout was then re-tested separately on USDJPY H1 with a fixed spread of 20 over 2018–21, 2022–24 and 2025–26:
- The stock setting (SL 40 / TP 80 pips), the one that scored 1.23 in the M5 test, scored 0.99 on 2018–21 in the H1 re-test.
- The in-sample best (SL 50 / TP 120) reached 1.31 and fell to 0.98 on 2018–21.
- Two settings held above 1.00 in all three windows: SL 30 / TP 120 at 1.12 / 1.16 / 1.14, and SL 30 / TP 80 at 1.09 / 1.15 / 1.10. They are the modest ones. The record calls this USDJPY-specific: cross-tests on EURJPY and GBPJPY lost in-sample.
So the most profitable-looking EA in a 53-design test cleared the bar in one test and sat at 0.99 on an earlier window. Its robust versions earn less. That is not a disappointing result; it is what a real, small edge looks like when you check it honestly.
What to look for before you trust a profit factor
Four checks separate a number that means something from one that only looks good. They apply to an EA you build and to one you are shown.
1. The trade count behind the ratio. A profit factor on 20 trades is noise with a decimal point. The Builder’s Measure panel refuses to call anything under 60 trades a pass, and 164 trades on one year is still thin. Read the count before the ratio, every time.
2. A window the settings never saw. Ask for the same rule on an earlier period, or on a hold-out after the fitting window. In our eight searches, no setting held above 1.00 on every window it was tested on, and two never cleared 1.00 even where they were fitted. If only one window exists, you are looking at a fit, not a finding. Walk-forward analysis is the systematic version of this check.
3. The drawdown paid for the net. Put the max drawdown and the net side by side. The grid basket’s +304.23 came with a -7.92% drawdown, so the account was further under water at one point than it ever ended up in profit. That can be a rational trade. It should be a chosen one.
4. The margin over costs. A profit factor of 1.03 means gross wins were 3% larger than gross losses. Anything that adds about 3% to the losing side — a wider spread than the tester used, commission, slippage on the entries that matter — erases it. The thinner the margin above 1.00, the more the result depends on your broker matching the test.
Running one in practice
Day-to-day operation is mostly not intervention. It is deciding in advance what would make you stop, and checking that the EA still behaves like its record.
- Re-run it on your own broker first. Open the Strategy Tester (
Ctrl+R), select the EA, and test it on the symbol and timeframe you will trade, on your broker’s history. A record on USDJPY M5 at one broker says nothing about EURUSD H1 at another. - Match the model when you compare. The records above use M1 OHLC. Re-running on
Every tick based on real tickschanges fills, so a “different” result may be a different test rather than a different EA. - Demo before money. Run it on a demo account long enough to see a losing stretch. The number you need is not the return. It is whether you will still be running it at the bottom of the drawdown you measured.
- Watch the right tabs. The Experts tab of the Toolbox carries the EA’s own log lines; the Journal tab carries the terminal’s execution record. An EA that “isn’t trading” is far more often a switch than a strategy. Algo Trading must be on in two places: the toolbar button and
Tools > Options > Expert Advisors > Allow Algo Trading. - Builder EAs need one extra line. A
.ex5compiled in the Builder checks in withhttps://aistrategyminer.comwhen it starts. Add that address underTools > Options > Expert Advisors > Allow WebRequest for listed URL, or the EA stops withaistrategyminer.com authorization failed - EA disabled. The Strategy Tester skips the check. - Compare against the record, not against zero. An EA down 1% whose record contains a 5% drawdown is behaving normally. One that trades three times as often as its record, or sits deeper than anything in it, is telling you something the rule cannot notice about itself.
Risk and drawdown reality
Three limits belong with the numbers.
Past results do not carry forward. A profit factor describes a window that already happened. The pending_breakout record is the clearest case here: the same rule and setting scored 1.23 in the M5 test and 0.99 on an earlier window in the H1 re-test.
Selection shapes what you are shown. A page listing only winning EAs is showing you what survived a filter, and the filter is the part you cannot see. The 53 designs above were not filtered for results, which is why you can see the 42 that lose. Ask any source how many designs it tested to find the ones it shows you.
A small edge is still an edge — and still small. The most robust settings in our data earned profit factors of 1.09 to 1.16. That is a real result and a thin one, easily consumed by costs you did not model. There is no guarantee of any result, and losses are part of every record on this page.
Next steps
From there:
- To see how a person compares with a rule set through a losing run, read EA vs manual trading.
- To turn a drawdown into a deposit and a lot size, read risk management for EA traders.
- For the full path from an idea to a compiled
.ex5, see create an EA without coding. - Before you search any settings, read parameter optimisation, which walks through the eight searches above in detail.
- If the EA came from somewhere else, how to use a free EA covers the checks that come first.