also: losing streak, max consecutive losses, worst run
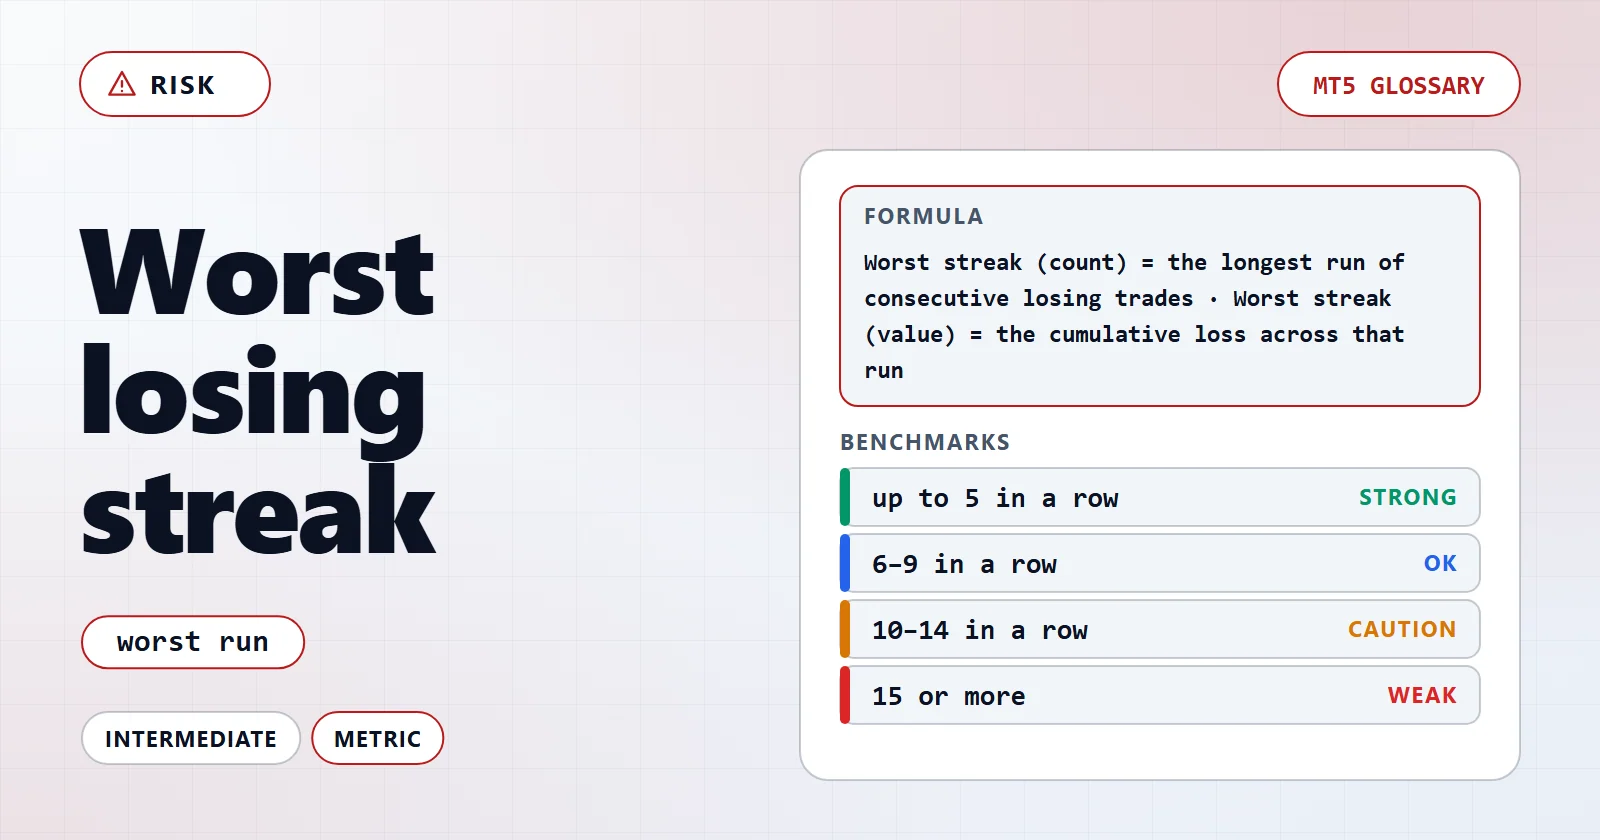
The longest consecutive series of losing trades or the largest cumulative loss within a contiguous run of losing trades in a backtest or live record.
Updated · Reviewed
At a glance
Term type
Metric
Difficulty
Intermediate
Used in
EA evaluation · Risk management
Strong reading
up to 5 in a row
In plain English
The longest run of losing trades the strategy has already been through, and how much that run cost. It is the number that predicts whether a trader will still be running the EA at the end of a bad stretch.
Why it matters
Most accounts do not fail because of a single catastrophic trade; they fail because someone switched off a working strategy during its worst run. Maximum drawdown says how deep the hole was, and worst streak says how many times in a row the strategy was wrong on the way down — which is the part people actually cannot sit through.
✓It converts a statistic into an experience. A 15% drawdown made of three losses feels like variance; the same 15% made of eleven consecutive losses feels like a broken EA, and that is when it gets turned off.
✓It is predictable from the win rate, so it can be checked before deployment rather than discovered during it. At a 40% win rate, runs of six are ordinary across a few hundred trades.
✓It sizes the account for behaviour rather than for arithmetic. Capital that survives the drawdown but not the streak is not enough capital, because the strategy will be abandoned before the recovery arrives.
How it is calculated
Worst streak (count) = the longest run of consecutive losing trades · Worst streak (value) = the cumulative loss across that run
Consecutive losing trades
Trades closed at a loss with no winning close between them, in trade-close order.
Cumulative loss
The sum of the losses in that run, as a share of the equity at the run's start.
The two definitions do not have to point at the same run. The longest run by count can be a sequence of small losses, while the costliest run by value can be shorter and heavier. Publish both, and say which one a quoted figure refers to.
What counts as high or low
up to 5 in a rowEasy to sit through for most strategy types
6–9 in a rowNormal for a trend-following design and its lower win rate
10–14 in a rowDemanding — expect intervention pressure at this length
15 or moreMost deployers stop the EA before the run ends
Read it together with
No single number describes a strategy. These metrics change how this one should be read.
The chance of a run of N losses in a row follows directly from the loss rate, so the expected worst streak can be read off the win rate before any money is deployed.
Win rate
40%
Loss rate 60%.
Chance a given trade starts a run of 6 losses
0.6⁶ ≈ 4.7%
Expected worst streak over 300 trades
about 9 losses
Longer runs are not anomalies; 300 trades at this win rate produce them.
Cost at 1% risk per trade
roughly 10% of equity
The streak that feels like the EA has broken is usually the streak the win rate predicted before deployment.
Calculation0.6⁶ = 0.0467 → a six-loss run appears roughly once every 21 trades at this win rate
ResultA ten-loss run is an ordinary feature of a 40% win rate, not evidence of failure
How to interpret it
A published streak figure is a floor, not a ceiling — it is the worst the sample happened to contain. Read it against the sample length and the win rate that produced it.
Range
What it means
Quoted without the trade count
Uninterpretable. A short sample cannot contain a long run, so a flattering streak figure may only mean the test was brief.
Count only, with no cost attached
Half the picture. Eleven small losses and five heavy ones are different problems for the same account.
Both count and cumulative cost, over several hundred trades
The figure worth planning around. It can be turned directly into a rule for when to intervene.
Live streak longer than the tested worst
A decision point rather than noise — the strategy is operating outside the behaviour its sample described.
Compute the expected streak from the win rate before deploying, then compare it with the tested one. If the tested streak is much shorter than the arithmetic predicts, the sample is too small to trust.
Multiply the streak by the risk per trade to get the equity it costs, then check that figure against the drawdown you have actually decided to accept.
Set the intervention rule before the run starts. A rule written during a losing streak is a decision made by the streak.
AIStrategyMiner EA pages publish the full closed-trade ledger beside the drawdown and trade count, so the streak can be counted from the record rather than quoted. The two describe different things a deployer has to survive.
Common mistakes
✕Treating a long streak as proof the EA has stopped working
At a 40% win rate, a run of ten losses is an ordinary product of a few hundred trades. Deciding a strategy is broken because it produced the run its own win rate predicts is the most common way a working EA gets switched off.
✕Assuming the published streak is the worst possible
It is the longest run inside the sample. A longer sample almost always finds a longer run, so the figure is a floor for future expectations rather than a limit.
✕Reading the count without the money
Streak length and streak cost are separate figures, and a strategy that varies its risk per trade can have its costliest run be one of its shorter ones.
✕Confusing the streak with the drawdown
Maximum drawdown is measured from an equity peak and can be produced by a single trade. A losing streak is a run of consecutive closes and can end above the previous peak if the run started from a high. They answer different questions.
In depth
What 33 published ledgers say about losing streaks
Each EA page ships a bt-trades.csv. Replaying it in close order gives the
longest run, the costliest run, and the run the win rate
predicts: ln(trades × win rate) ÷ ln(1 ÷ loss rate).
33 backtest ledgers
Figure
Longest run: shortest / median / longest
2 / 8 / 38 trades
Records by longest run: ≤5 · 6–9 · 10–14 · ≥15
9 · 10 · 9 · 5
Costliest run shorter than the longest run
12 of 33
Costliest run deeper than the listing’s maximum drawdown
0 of 33 (median share 63%)
Longest run beats the prediction by more than 4 trades
6 of 33, all multi-leg
Held-out windows (7–330 trades) beating the backtest run
0 of 32
Count and cost often diverge: Iridescence’s longest run is eight trades, but
its costliest is two, at 5.27%. A stop rule in trades and one in money fire
on different days.
Where the win rate stops predicting
Ledger
Win rate · trades
Predicted run
Longest run
Chrysalis
70.7% · 693
about 5
35
Nautical
30.22% · 756
about 15
38
Murmuration
45.36% · 1,709
about 11
26
Cairn
63.99% · 4,583
about 8
14
Longbow
24.34% · 467
about 17
13
The tester counts a portfolio’s closes in one sequence, so a week that stops
every leg becomes one long run. That is how Chrysalis reaches 35 while
winning seven in ten, at a cost of 12.87%. Longbow is the opposite: its 13-loss
run is shorter than the 17 its own win rate allows.
Where to read it in MT5
The Strategy Tester report carries both definitions on two rows.
“Maximum consecutive losses” gives the count with the money in brackets;
“Maximal consecutive loss” gives the money with the count in brackets. On 12
of the 33 ledgers the two counts differ.
Nine portfolio builds expose it as the input
PortfolioMaxConsecutiveLosses, which halts every leg for the rest of the day
after that many losing closes and ships at 0 (off). Set it from the ledger: 3
fires inside the first year on 29 of the 33 records, and nine never exceed five
in a row. The ea-vs-manual replay prices that
early exit.
Related terms and what to check next
The streak is the count and the maximum drawdown
is the hole; on every ledger here the hole is at least as deep as the costliest run.
Predict the count from the win rate, price it with the
expectancy, and let the
risk of ruin calculator turn the three into odds.
Then sort the EA catalogue by drawdown.
Frequently asked questions
How long a losing streak should I expect from an EA?
It follows from the win rate and the trade count. At a 40% win rate a run of ten losses appears routinely across a few hundred trades; at a 70% win rate a run of six is already unusual. Compute the expectation from the win rate before deploying rather than reacting when the run arrives.
Is the worst losing streak the same as maximum drawdown?
No. Maximum drawdown is the deepest peak-to-trough decline in equity and can be caused by one trade. A losing streak counts consecutive losing closes and says nothing about equity, though a long streak usually produces a deep drawdown.
Why publish the streak when drawdown is already published?
Because they predict different failures. Drawdown predicts whether the account has enough capital; the streak predicts whether the person running it will still be running it at the end. Most strategies are abandoned mid-streak, not at a drawdown's bottom.