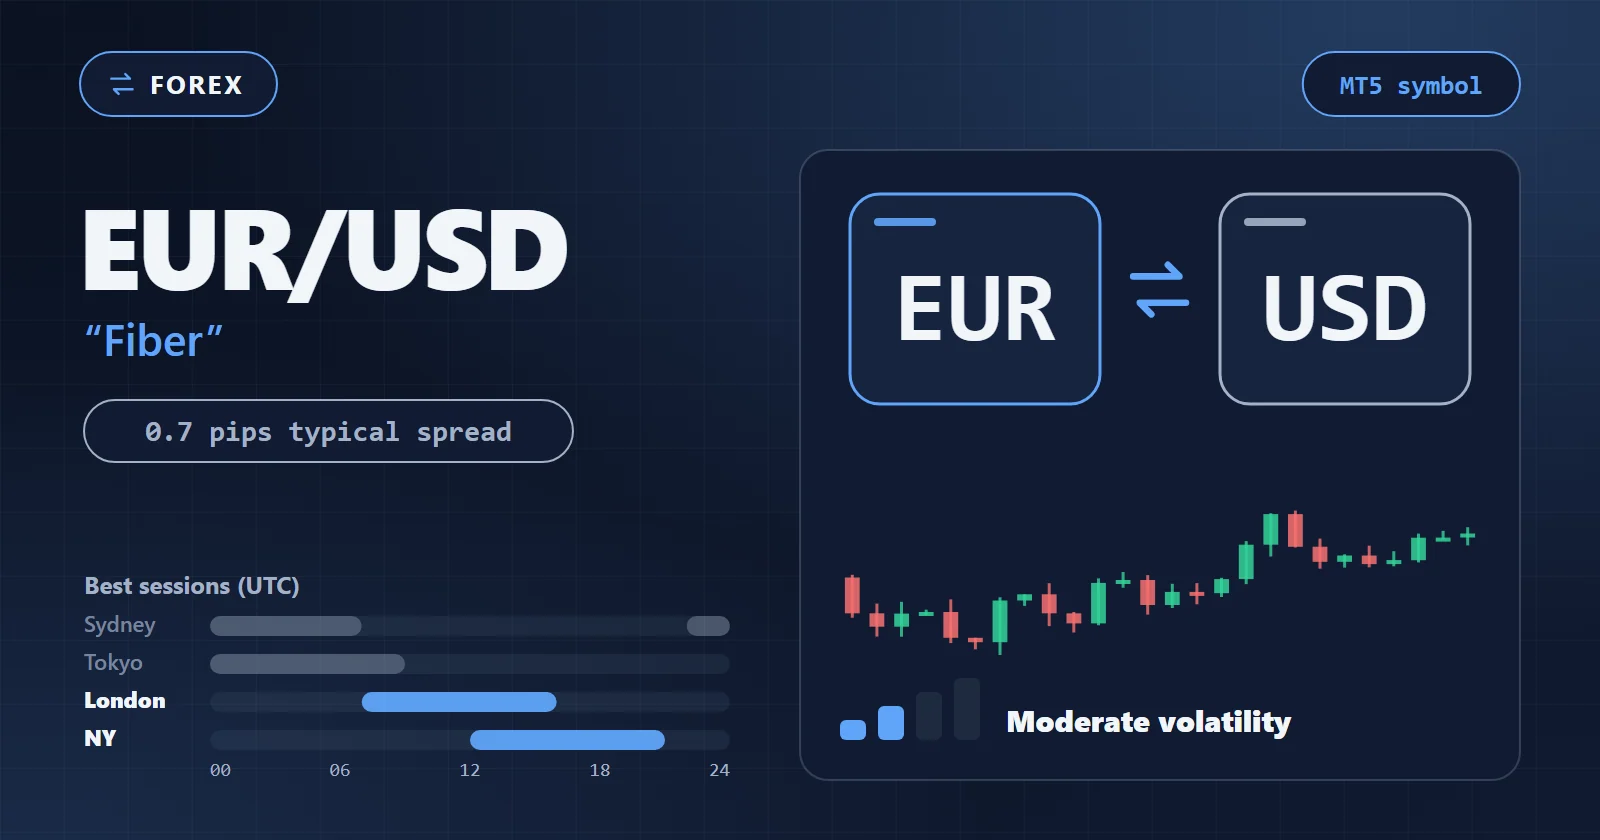
Forex Moderate volatility

EUR/USD · Fiber

The most liquid forex pair globally. Tight spreads, deep order books, and clear technical structure make it the default surface for systematic strategies — and the first market to hold any EA claim against real tick data.
Updated

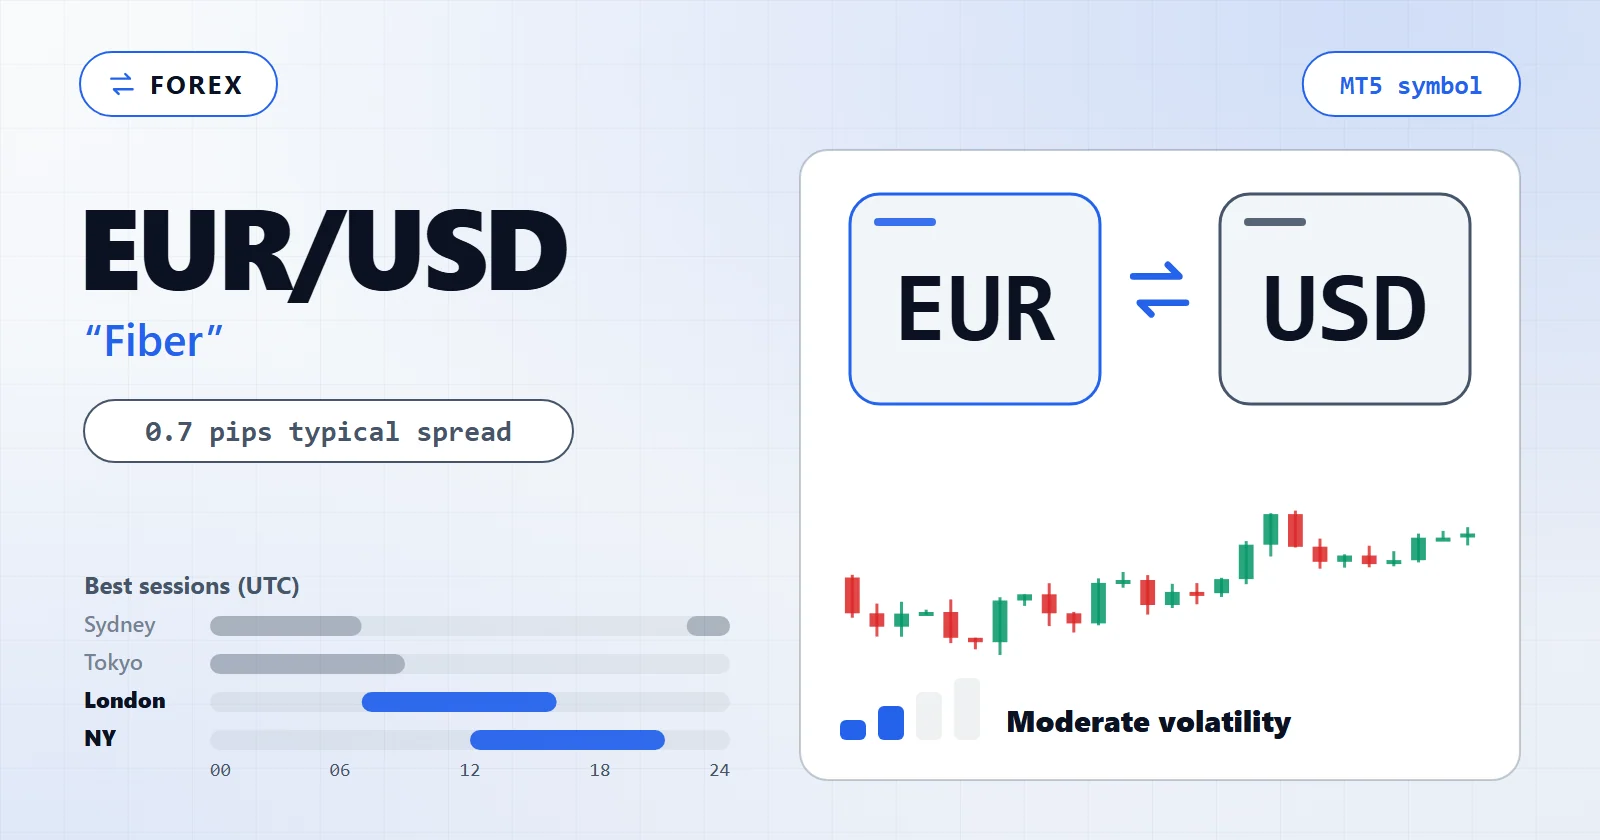
EUR/USD (Fiber) — MT5 symbol overview

At a glance

Avg. spread (typical) Typical estimate (broker-published)

0.7 pips

Broker-published, standard account

Average daily range Measured from our own data through 2026-07-21

≈54 pips

20-day measured average

Best sessions (UTC) Measured from our own data through 2026-07-21

London · NY

12:00 – 16:00 UTC

Volatility level

moderate

Profile classification

Typical values from each broker's own published EUR/USD figures (2026-07) — confirm the live spread on your own account type.

24h market sessions & volatility (UTC) Measured from our own data through 2026-07-21

Median hourly range measured over the last 12 months of our own tick-derived bar data. Session bands follow the same DST-aware windows as the timeline below.

Horizontal axis: hour of day (UTC). Vertical axis: hourly range in pips — the line is the median, the shaded band the p25–p75 range distribution. The green block marks the measured best entry window; the tinted blocks are the Tokyo, London and New York sessions.

Best entry window

12:00 – 16:00 UTC

Quietest window

19:00 – 24:00 UTC

Peak volatility hour

14:00 · 17.9p

Hourly range distribution 14.3–24.5p (p25–p75)

High-impact news

ECB and Fed events land inside the busiest windows — check the economic calendar before fast strategies trade.

Server-time warning

All hours are UTC. Your broker's server clock may differ — verify it before using any session filter.

Both windows are derived from the measured hourly ranges by a fixed rule — not hand-picked. Best = the four consecutive hours with the highest median range; quietest = the five with the lowest.

Symbol profile

What the data says about EUR/USD

Market behavior

  • High liquidity and tight spreads around the clock
  • Directional moves concentrate in London and NY hours
  • Range-bound in the Asian session; Tokyo moves often reverse at the London open
  • Sensitive to ECB/Fed policy and US data surprises

LiquidSession-drivenMajor

Execution profile

  • Deep order book — retail-size stop orders fill at the level
  • Lowest cost-of-trading surface among the pairs we cover
  • Suits pending-order and session-window logic

Low costDeep book

Primary drivers

Monetary policy
Fed and ECB rate paths give the pair two distinct catalysts per cycle.
US economic data
NFP, CPI, PMI and GDP releases move the pair inside the NY window.
Risk sentiment
USD safe-haven flows dominate in risk-off phases.
Correlated markets
Moves with GBP/USD and AUD/USD, inversely with USD/CHF — measured 20-day figures in the correlation card.

Correlation (20D) Measured from our own data through 2026-07-21

GBP/USD
+0.81
USD/JPY
-0.40
USD/CHF
-0.88
AUD/USD
+0.65
XAU/USD
+0.45

Pearson correlation of daily log returns over the last 20 common trading days.

Strategy & timing

Which strategies fit EUR/USD, and when it moves

Strategy fit Editorial assessment — not a measurement

Scores are our team's editorial assessment based on the analysis on this page — not a measurement, and never a promise.

StrategyFit (0–5)Why
Breakout5.0 / 5The daily range is objective and the London open resolves it on schedule.
Trend4.5 / 5Clear directional legs during the London and NY sessions.
News4.0 / 5Scheduled ECB/Fed events create measurable moves — with spread-widening risk.
Scalping3.5 / 5Cheap on raw accounts, but cheap is not an edge — validate on tick data first.
Mean Reversion3.0 / 5Works in calm regimes; a wider test window is what exposes the regime dependence.
Grid / Martingale2.0 / 5Averaging ladders look strongest in a calm window and fail in a long one-way move — see the averaging note below.

Session volatility breakdown Measured from our own data through 2026-07-21

Median session range over the last 90 calendar days of trading, in pips.

Tokyo00-09 UTC
28.6 pips
London07-16 UTC
39.7 pips
New York12-21 UTC
37.9 pips
London–NY overlap12-16 UTC
29.1 pips

Data

Trading conditions

Session windows, broker spreads, and cost math for this symbol — measured and typical values, not marketing.

Trading costs by account type

Measured from our own data through 2026-07-21 Measured from our own data Typical estimate (broker-published) Typical estimate (broker-published) Broker-dependent Broker-dependent

Account typeTypical spreadCommissionAvg. daily rangeSpread / rangeSlippage sensitivity
Standard account0.7 – 1.6 pips Typical estimate (broker-published) $0 Typical estimate (broker-published) ≈54 pips Measured from our own data through 2026-07-21 1.3% – 3.0% Typical estimate (broker-published) Low Broker-dependent
Raw / ECN account0.0 – 0.3 pips Typical estimate (broker-published) $3 – $7 / lot Typical estimate (broker-published) ≈54 pips Measured from our own data through 2026-07-21 < 0.6% Typical estimate (broker-published) Very low Broker-dependent

Values are typical ranges across brokers and vary by broker, time and market conditions — confirm on your own account type.

Trading sessions

Sydney — 21:00–06:00 UTC
Tokyo — 00:00–09:00 UTC
London Best sessions — 07:00–16:00 UTC
New York Best sessions — 12:00–21:00 UTC

Times are UTC and adjust automatically for daylight saving (Tokyo has no DST). The timeline shows the current UTC day; the vertical marker is the time right now.

How each window trades

Tokyo (00–09 UTC)
Thin liquidity, range-bound — not the right window for breakout EAs. Range moves here often reverse at the London open, so unfiltered trend signals from these hours are structurally suspect.
London open (07–11 UTC)
The highest-volume window, with directional moves and meaningful range expansion. Trend, breakout, and news EAs find their best signals here.
NY overlap (12–16 UTC)
London and New York combined liquidity, often the day's highest range and tightest spreads.
NY close (20–22 UTC)
Range contraction and false breakouts; EAs that filter for session quality avoid these hours.

Standard spreads by broker

Broker Standard spread (pips) Raw-type commission
Exness 0.7 $3.5/lot on Raw
TitanFX 1.0 $7/lot on Blade
AXIORY 1.1 $3.5/lot on Nano
FXGT 1.2 $3/lot on PRO
HFM 1.2 $3/lot on Zero
XM 1.6 $3.5/lot on Zero

Standard-account spreads are each broker's own published figures (checked 2026-07); raw-type accounts compress to sub-pip spreads plus the listed commission. Confirm live values on your own account type.

Position planning

Pip value · Spread cost

LotsPip valueCost at 0.7 pips
0.010.1 USD0.07 USD
0.101 USD0.7 USD
1.0010 USD7 USD

Values in USD, the quote currency.

Required margin

Enter a price to calculate

Planning estimates from the typical values on this page — not live quotes. Actual pip value, margin and spread depend on your broker's contract specification and account currency.

Key facts

Base currency
EUR
Quote currency
USD
Pip size
0.0001
Point size
0.00001
Contract size
100,000 EUR
Margin currency
EUR
Trading hours
24h, Monday–Friday

Volatility & timing

When EUR/USD actually moves

Three measured views of the same tick-derived bars: which weekday-hours run hottest, how monthly volatility is trending, and which hours lean directional.

Weekday × hour heatmap Measured from our own data through 2026-07-21

Median hourly range by weekday over the last 12 months. Darker = wider typical range.

Quiet Active
Most active
Tue 14:00 UTC · 20.4p
Quietest
Mon 22:00 UTC · 4.8p

Volatility trend (12 months) Measured from our own data through 2026-07-21

Average daily range per calendar month — is the pair speeding up or calming down?

Latest month
Jul 2026 · 52.3p
12-month range
48.5–96.8p

Recent months are calmer than the prior quarter — ranges are compressing.

Directional bias by hour Measured from our own data through 2026-07-21

Share of hourly bars that closed up, by UTC hour, over the last 12 months. Above the midline leans bullish; below leans bearish.

Most bullish hour
21:00 UTC · 61.2%
Most bearish hour
17:00 UTC · 41.8%

Hourly bias is a mild historical tendency around 50% — not a standalone signal.

Analysis

EUR/USD: the full analysis

On this page (8 sections)

The best EA for EUR/USD is the one whose full backtest you can read before you run it — and the only backtest you can read in full is one you ran yourself. Hold every EUR/USD result, bought or built, to that bar: a multi-year every-tick test at your own spread, across the regimes a sales page leaves out, with the worst losing streak read before the headline.

This page covers what EUR/USD gives an automated strategy that other pairs do not, which strategy shapes the pair’s character actually supports, and the sessions that decide results. It also covers the test bar a EUR/USD EA should clear — including the losing streaks and the regime dependence that the sales pages of other sites leave out. The session timeline, broker spread table, and cost calculators live in the Trading conditions section above; this analysis is the interpretation.

How EUR/USD Behaves: What the Pair Gives an EA

EUR/USD accounts for roughly 23% of global forex volume. The combination of European Central Bank policy and Federal Reserve policy gives it two distinct catalysts per cycle. That is why systematic models built on rate-differential mean-reversion or trend-momentum tend to back-test cleanly here.

For an EA, the pair’s character reduces to three measurable properties:

  • Moderate volatility, dependable range. A typical daily range of about :measured[adr] pips is enough for a breakout to pay a 2:1 reward-to-risk target, without the 150-pip whips that force wide stops on GBP/JPY. Fixed-pip stop and target values stay meaningful across months.
  • Depth at the touch. The order book is deep enough that a retail-size stop order at the previous day’s high fills at the level rather than several points through it. Strategies whose edge lives in entry precision — pending-order breakouts, grid rungs at fixed distances — degrade least on this pair.
  • Session structure that repeats. The overnight range, the London resolution, and the NY overlap arrive on schedule every day. That is why clock-anchored logic works here. A breakout EA can place pending orders off a range snapshot taken at a fixed server hour and expect that boundary to mean the same thing tomorrow. That design only makes sense on a pair whose sessions behave.

The trap inside that last property: a fixed hour means your broker’s server clock, not UTC. Move a clock-anchored EA between brokers with different server timezones and every range boundary silently shifts. Re-check the time inputs (and re-run the backtest) whenever the broker changes.

Which EA Strategies Suit EUR/USD?

The pair’s frontmatter lists trend, scalping, mean-reversion, and breakout as suitable — but suitability is not proof, and our own testing points the same way: defaults lose, validation pays. In our own stock-settings baseline of the Builder’s templates — a single USD/JPY M5 run over one year, default inputs, no optimisation — most finished below a 1.0 profit factor, and the only EUR/USD exposure in it came from the two basket templates, both of which also finished below 1.0. Almost none cleared the Builder’s own bar at stock settings, so treat any edge on EUR/USD as something your own settings and test have to earn. Look for it in mechanics like pending stop orders and session windows, not in the indicator on the box.

What the pair’s character supports on EUR/USD specifically:

  • Breakout with pending orders. The daily range is objective and the London open resolves it on schedule. The honest cost of the shape is a low win rate — many small stop-outs paid for by rare large wins. Judge a breakout EA by its worst losing streak, not its headline profit factor.
  • Mean-reversion and averaging systems. EUR/USD’s moderate volatility is precisely what makes an averaging ladder look strong in a calm test window: without a sustained one-way trend, nearly every basket eventually closes. A wider window that contains a long one-way move is what exposes it. That is a regime observation, not a property of the pair’s nature — see the risk section.
  • Scalping — only on raw accounts, only after validation. The cost math works at sub-pip spreads with $3-7/lot commission. It stops working at 1.6 pips all-in. Treat any EUR/USD scalper — built in the Builder or bought anywhere — as unproven until your own tick-data test says otherwise.
  • Multi-symbol baskets. Correlation with GBP/USD and AUD/USD is what makes EUR/USD-anchored baskets coherent — and what doubles your exposure when you run separate EAs on correlated pairs without noticing. The concrete Builder recipes are in the products section below.

Best Trading Hours for EUR/USD EAs

The session timeline and the per-window notes in the Trading conditions section above show when EUR/USD is liquid. What decides an EA’s results is which of those windows its logic is allowed to trade.

EAs that restrict trading to London-and-NY hours typically out-perform 24-hour variants on this pair. A session filter on EUR/USD is not an optimisation flourish; it is part of the strategy definition. The Tokyo window is the structural reason. Its range moves often reverse at the London open, so a 24-hour EA spends a third of each day trading signals the next session is statistically likely to unwind.

The one caveat: scheduled ECB and Fed events sit inside those “good” windows, and spreads widen exactly then. A news filter (or a pause around rate decisions) protects fast strategies from paying triple spread at the worst moment.

Spreads, Costs, and Execution

EUR/USD is the lowest cost-of-trading surface among the pairs we cover, but the gap between brokers is wider than most users expect. The broker-by-broker table in the Trading conditions section above lists each broker’s own published standard-account spread, from 0.7 to 1.6 pips.

The arithmetic that matters: the 0.9-pip gap between the tightest (0.7) and widest (1.6) standard spread is about $9 per standard-lot round-turn. For a swing EA trading a few times a week, that is noise. For a high-frequency system trading many times a day, the same gap is a recurring tax on every entry. High-frequency EAs therefore belong on raw-type accounts where the spread compresses to sub-pip levels and the commission is a fixed, known number.

Two cost rules specific to this pair:

  1. Backtest with your account type’s spread, not the pair’s reputation. A EUR/USD scalper validated at 0.7 pips and deployed on a 1.6-pip account is running a different strategy.
  2. Spread filters can stay loose here. Pending stop entries at range edges are less spread-sensitive than market fills, so a breakout EA can run a looser spread cap on EUR/USD than would be safe on an exotic pair. That holds only after the backtest was run at your account’s real spread.

Risks to Test Before Going Live

  1. Low-volatility years starve breakout systems. A breakout EA on this pair can spend an entire calm year in small stop-outs with no measured move to pay for them — a flat year is normal operation, not a malfunction. If your plan cannot absorb one, the strategy will be abandoned exactly when it is behaving normally.
  2. Calm years flatter averaging systems. A calm window that starves a breakout EA is exactly the one that feeds an averaging ladder — and a wider window that contains a long one-way move is what takes the ladder apart. No single test window tells you what the next regime does; it tells you the shape of the EA’s dependence on regime.
  3. ECB/Fed event risk clusters inside the best sessions. Rate decisions widen spreads and gap prices inside the London/NY windows where EUR/USD EAs concentrate their trading. Fast strategies need a news pause; slower ones need stops that survive a 30-pip gap.
  4. Correlation is hidden leverage. EUR/USD moves with GBP/USD and AUD/USD. Two “diversified” EAs on two correlated pairs are one position with extra steps.
  5. Server-clock drift breaks clock-anchored logic silently. Every session filter and range snapshot on this page assumes the broker’s server time. Verify it in MT5 (the Market Watch clock) before the first live trade, and re-verify after any broker migration.

How to Test a EUR/USD EA

  1. Match the account type to trade frequency. Under ~50 trades a month, a standard account’s all-in spread is fine; above it, use a raw-type account — on EUR/USD the difference compounds into the largest controllable cost you have.
  2. Verify the server clock against the sessions you want. In MT5, compare the Market Watch time to UTC and shift any session filter accordingly. Every clock-anchored input in this article assumes server time.
  3. Backtest on tick data with your account’s real spread. Hold any EA — bought or built — to the bar in the next section. That means an every-tick model with published modelling quality and a multi-year window that includes the regimes the sales page avoids. Run a demo period before funding.
  4. Size for the stated failure mode, not the average month. Take the worst measured drawdown and losing streak from the backtest and set the deposit floor so that worst case is survivable — the floor exists so the drawdown math survives contact with reality.

EUR/USD EAs and Builder Templates

We have not published a EUR/USD backtest of our own, and a result from another pair — even another major — does not carry over to EUR/USD’s cost structure and session clock. The honest route to a EUR/USD EA is to build one and hold it to a bar like this before you fund it:

Test barBar
Test window2019–2025 (wider than the calm window marketing prefers)
Price modelEvery-tick, at your account’s real spread
Profit factor≥ 1.2
Max drawdown≤ 20%
OutcomeRecorded either way — a failed run tells you as much as a pass

A build that fails this bar has saved you the deposit you would have lost finding out live. The site’s methodology sets out the same checks in full, and the Builder templates at the end of this section exist to build a EUR/USD candidate and run it through them.

Why averaging systems need the widest window

An averaging ladder adds to a losing position at fixed distances and closes the whole basket on a small retrace. On a moderate-volatility pair in a calm window, that retrace nearly always arrives, so the equity curve looks smooth and the profit factor looks healthy. Run the same ladder across a window that contains a long one-way move and the basket keeps growing while the retrace never comes. Judge any ladder on its deepest basket and its equity drawdown, not on the smooth part of the curve.

Builder templates pre-wired for EUR/USD

In the Builder, EUR/USD is the anchor leg of the dual-pair RSI template (RSI period 14, SL 30 / TP 60 pips per leg). It is also the anchor leg of the risk-on/risk-off basket (one MA-cross signal firing EURUSD and AUDUSD together, SL 40 / TP 80 pips). Both generate a ready-to-run MT5 Expert Advisor (.ex5; the editable .mq5 source comes with Pro) with every parameter exposed, so the correlation exposure described above is something you configure deliberately rather than discover later.

No figure on this page is a promise: spreads are broker-published typical values, the test bar is a threshold rather than a result, and any backtest you run is sensitive to spread, server clock and regime. The correct reading of “best EA for EUR/USD” is the one whose worst losing streak you have already budgeted for.

Frequently asked questions

What is the best EA for EUR/USD?
No EA is best on EUR/USD in general — a EUR/USD EA is only as good as the payoff shape you can hold and its test. The practical route is the EA Builder: decide first which payoff shape you can hold — many small losses for rare large wins, or frequent small wins with rare deep drawdowns — then test it on tick data at your own broker's spread and hold it to a clear bar (2019-2025 window, every-tick model, profit factor ≥ 1.2, max drawdown ≤ 20%) before you fund it.
Is EUR/USD good for scalping EAs?
It is the cheapest surface to try: EUR/USD standard-account spreads typically run 0.7 to 1.6 pips across brokers, and raw-type accounts compress to sub-pip spreads plus a $3-7 per-lot commission. But cheap execution is not an edge. In our own stock-settings baseline of the Builder's templates — a single USD/JPY M5 run over one year, default inputs, no optimisation — most finished below a 1.0 profit factor, including the two basket templates whose legs trade EUR/USD, so a scalping EA on EUR/USD must be validated on tick data with realistic spread for your exact account type before it earns anything.
Can I run a martingale EA safely on EUR/USD?
Not safely in the sense most sales pages imply. Averaging ladders can look strong in a calm window, because on a moderate-volatility pair the small retrace that closes each basket almost always arrives — but the mechanism that produces those smooth curves is the same one that damages accounts in a strong one-way trend. Test any ladder across a window that includes one, such as 2019-2025 with every-tick data, and judge it on its deepest basket and its equity drawdown against a hard limit such as 20%. If you run any martingale, do it on a dedicated account, with an equity guard you never disable, and with the tail risk stated in numbers first.
Which sessions should a EUR/USD EA trade?
London and New York. The London open (07-11 UTC) is the highest-volume window and resolves the overnight range; the NY overlap (12-16 UTC) combines both books and usually prints the day's tightest spreads. The Tokyo session is range-bound and its moves often reverse at the London open, which is why session-filtered EAs on this pair typically out-perform 24-hour variants. Check the filter against your broker's server clock, not your local time.
How much money do I need to run an EA on EUR/USD?
It depends on the EA's loss profile, not the pair. The general rule: take the EA's worst measured drawdown and losing streak from a full tick-data backtest, then size the deposit so that worst case costs a share of the account you can actually hold. As a concrete shape: a breakout system that wins rarely needs enough headroom to sit through 20+ consecutive small losses without forcing you to switch it off, while an averaging system needs the margin math of its deepest basket checked against your leverage before the first trade. The Builder exposes lot sizing and stop distances on every template so you can run that math before funding.

Build your own EA for EUR/USD

Open the AIStrategyMiner Builder with this symbol already selected, build the rules from blocks, then test them on your own price history before you decide anything.

  • Compile a standard .ex5 file for MetaTrader 5 and check it in the Strategy Tester.

Test any EA in the MetaTrader 5 Strategy Tester before you rely on it. Past results do not predict future ones.
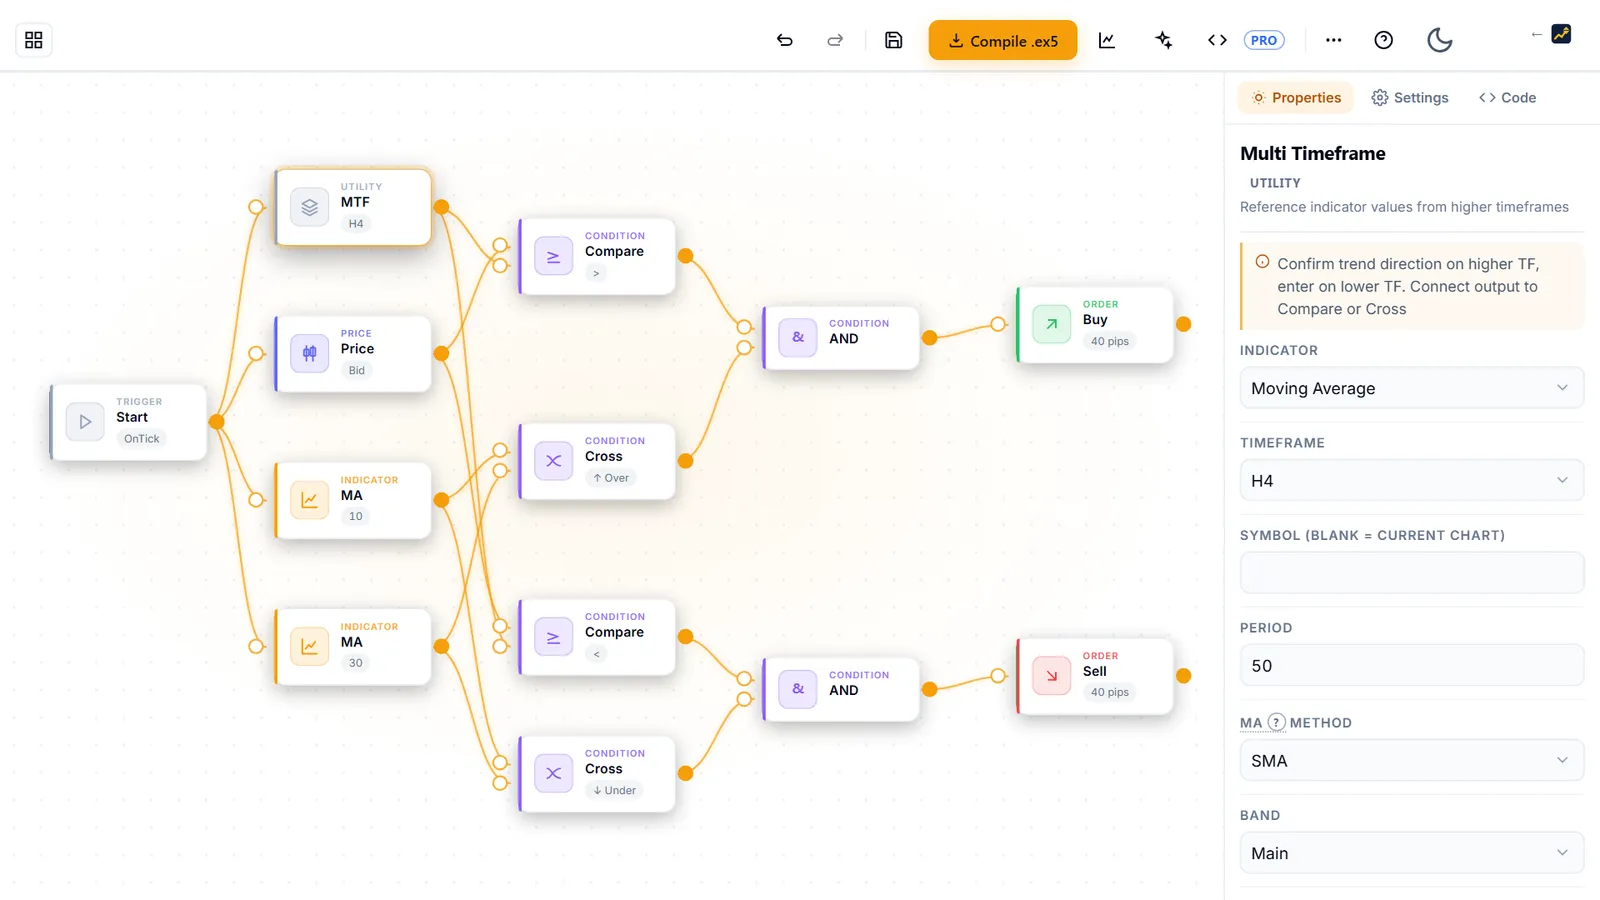
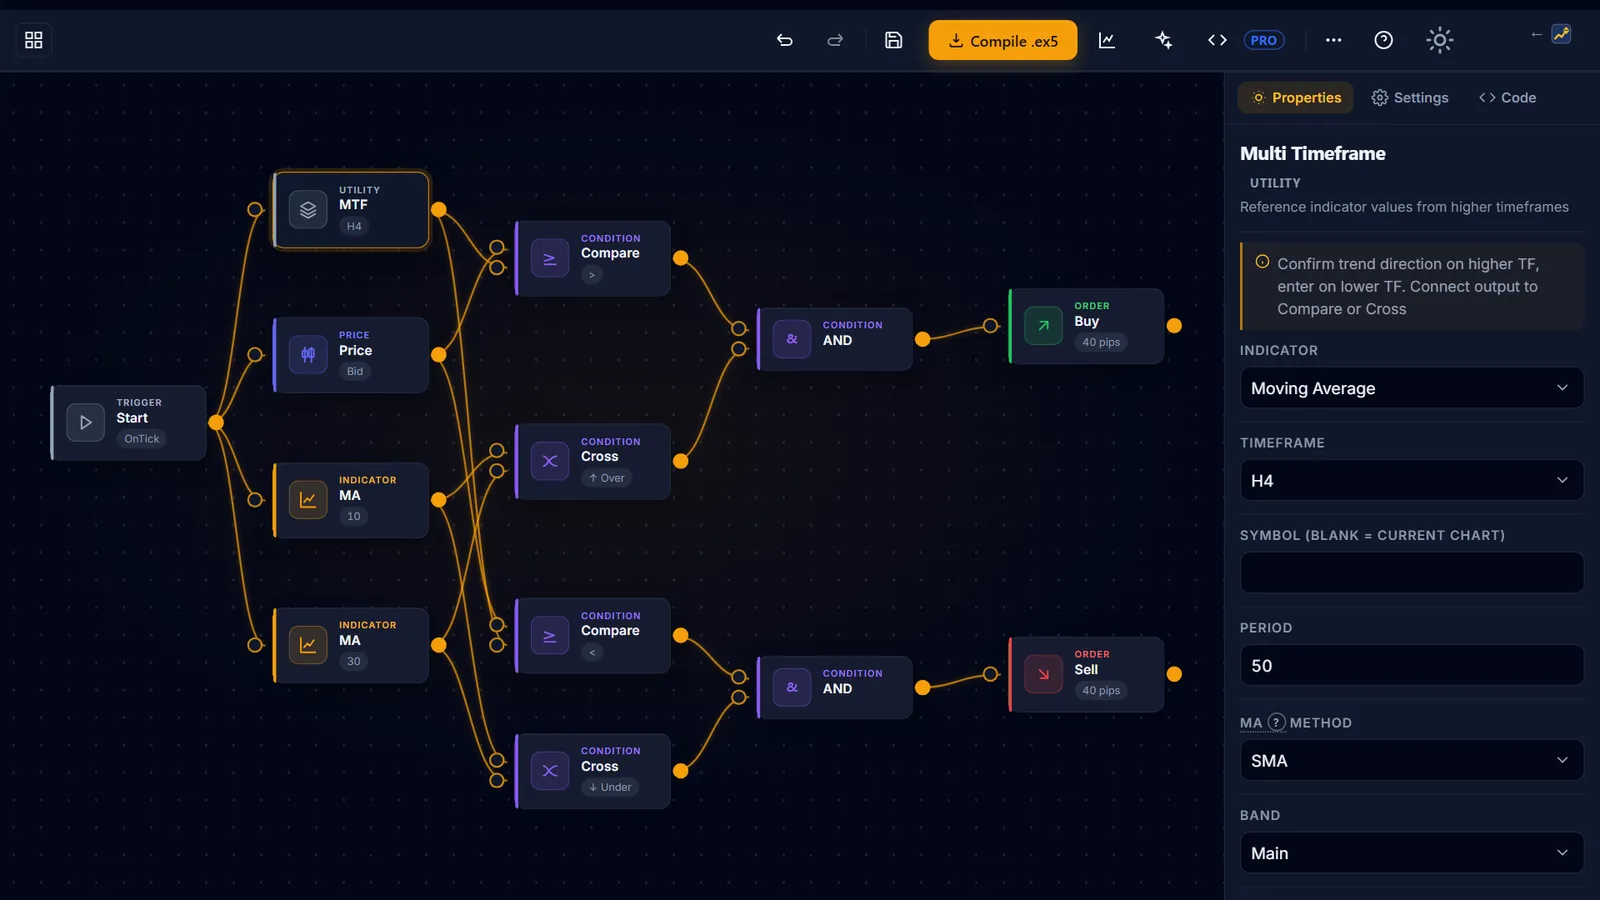
AIStrategyMiner EA Builder: strategy blocks wired together on a canvas, with the properties panel on the right