NZD/USD — “the Kiwi” — is the commodity majors’ smaller sibling. It is a dairy-and-risk barometer that trades less volume than EUR/USD or the Aussie, and behaves more like a bet on the global risk cycle than on the dollar alone. The framing that decides everything else is whether your strategy actually wants that character or merely tolerates it. A trend EA that feeds on commodity and risk-on/risk-off swings finds a genuine edge here. A system that just needs a liquid, EUR/USD-shaped major will meet wider relative spreads, thinner books, and a correlation to AUD/USD that quietly undoes any “diversification” it thought it had.
This page covers what Kiwi gives an automated strategy that EUR/USD does not, the sessions that decide its results, and what it costs. It then covers the failure modes that catch systems ported from calmer or more liquid pairs, and how to build and test an NZD/USD EA of your own.
How NZD/USD Behaves: What Kiwi Gives an EA
NZD/USD is a commodity currency first and a USD pair second. New Zealand is a small, export-driven economy dominated by dairy, so the Kiwi reacts to inputs that never appear on a standard FX calendar. Fortnightly dairy-auction results and Chinese-demand data move it as much as some scheduled releases do. Stacked on top of that is a strong risk-on/risk-off character shared with the Aussie. For an EA, the pair’s behaviour reduces to three properties:
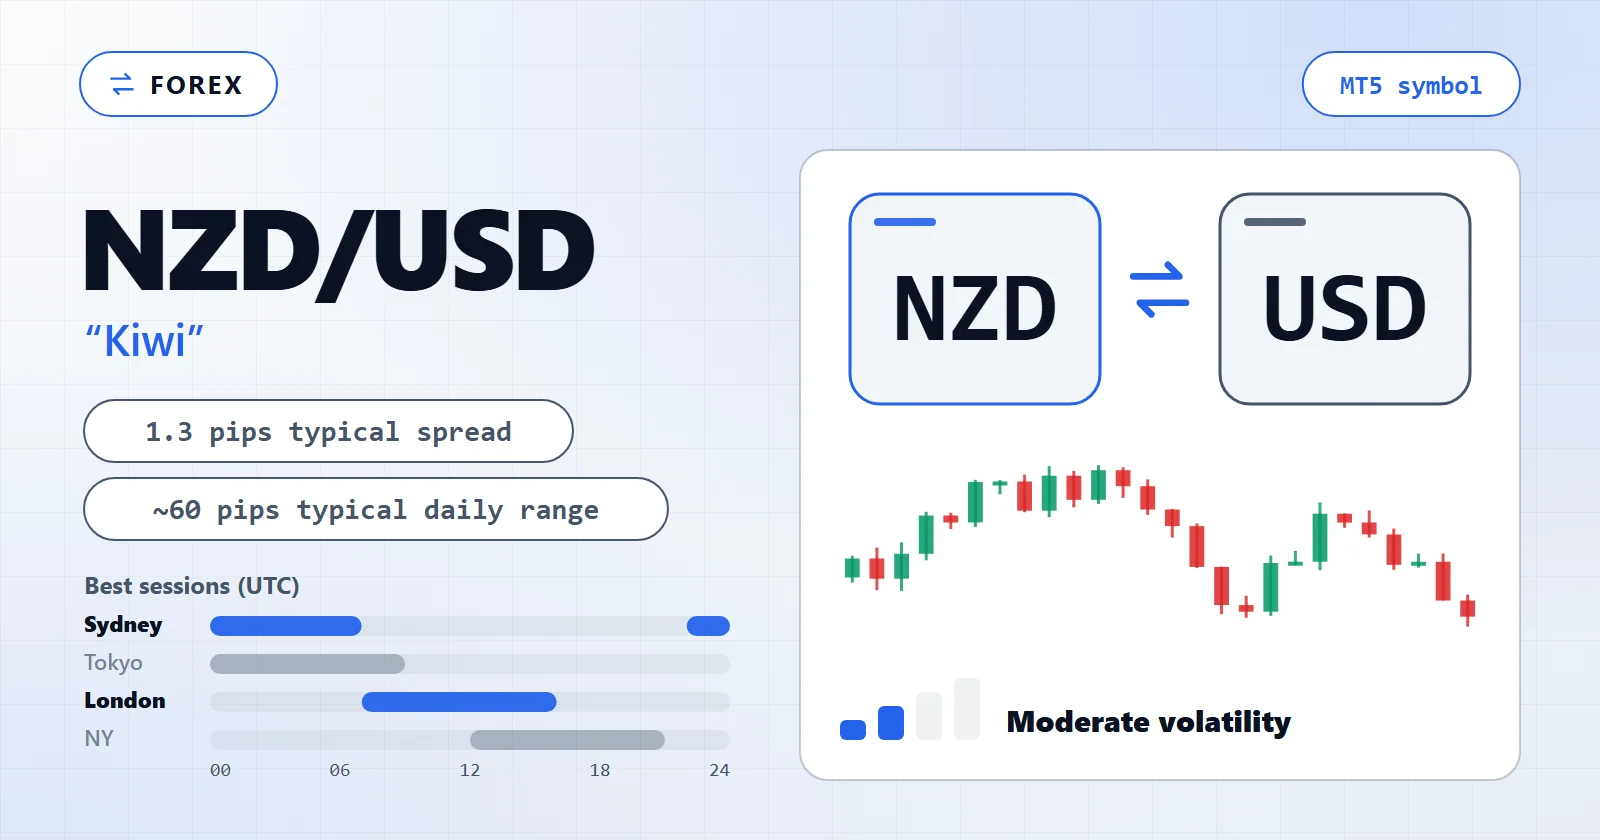
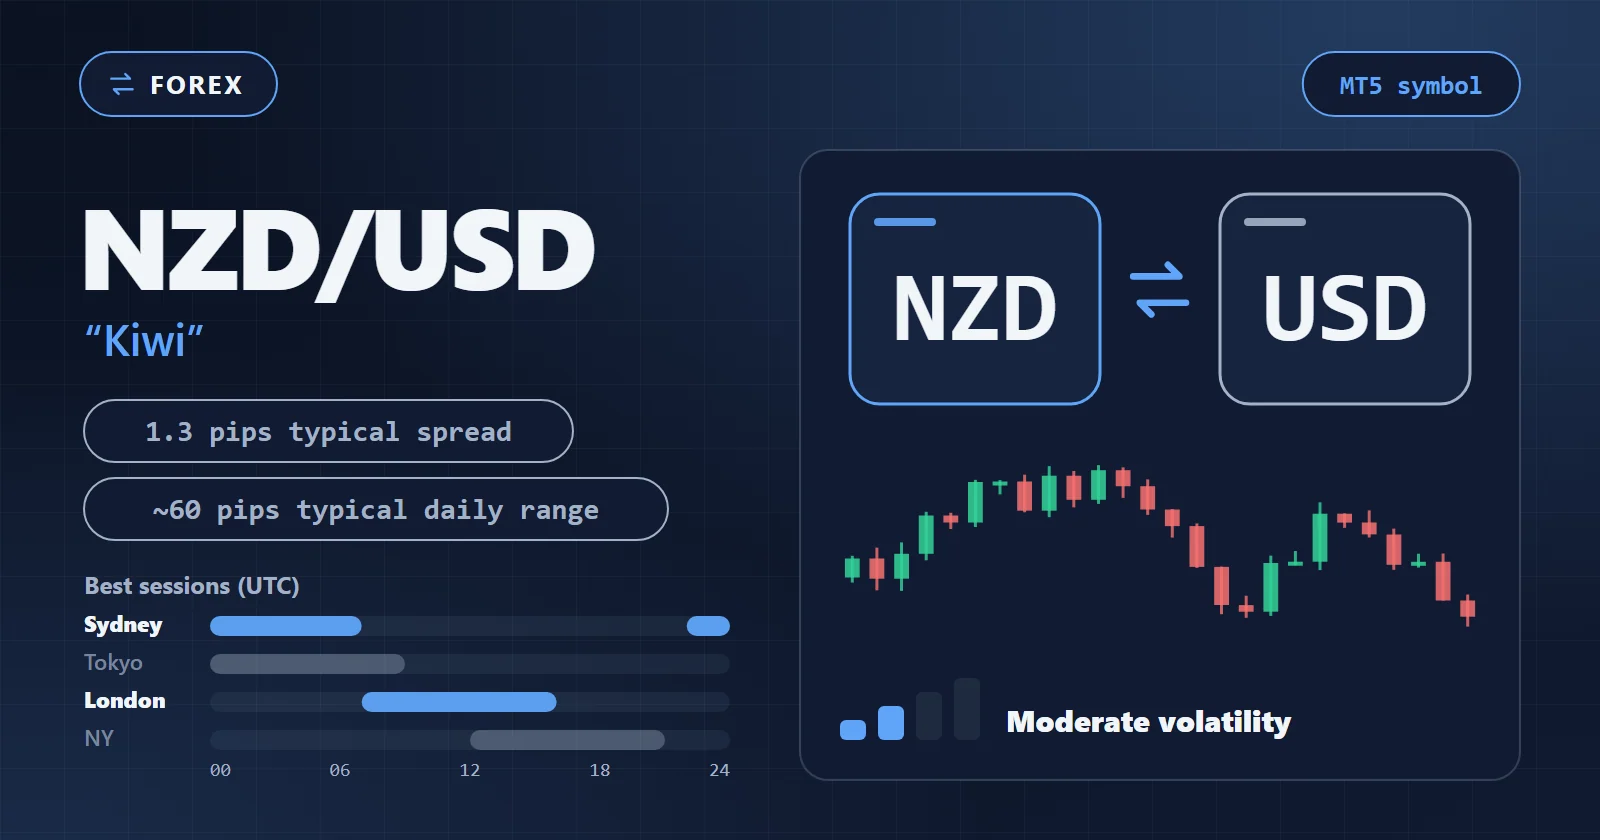
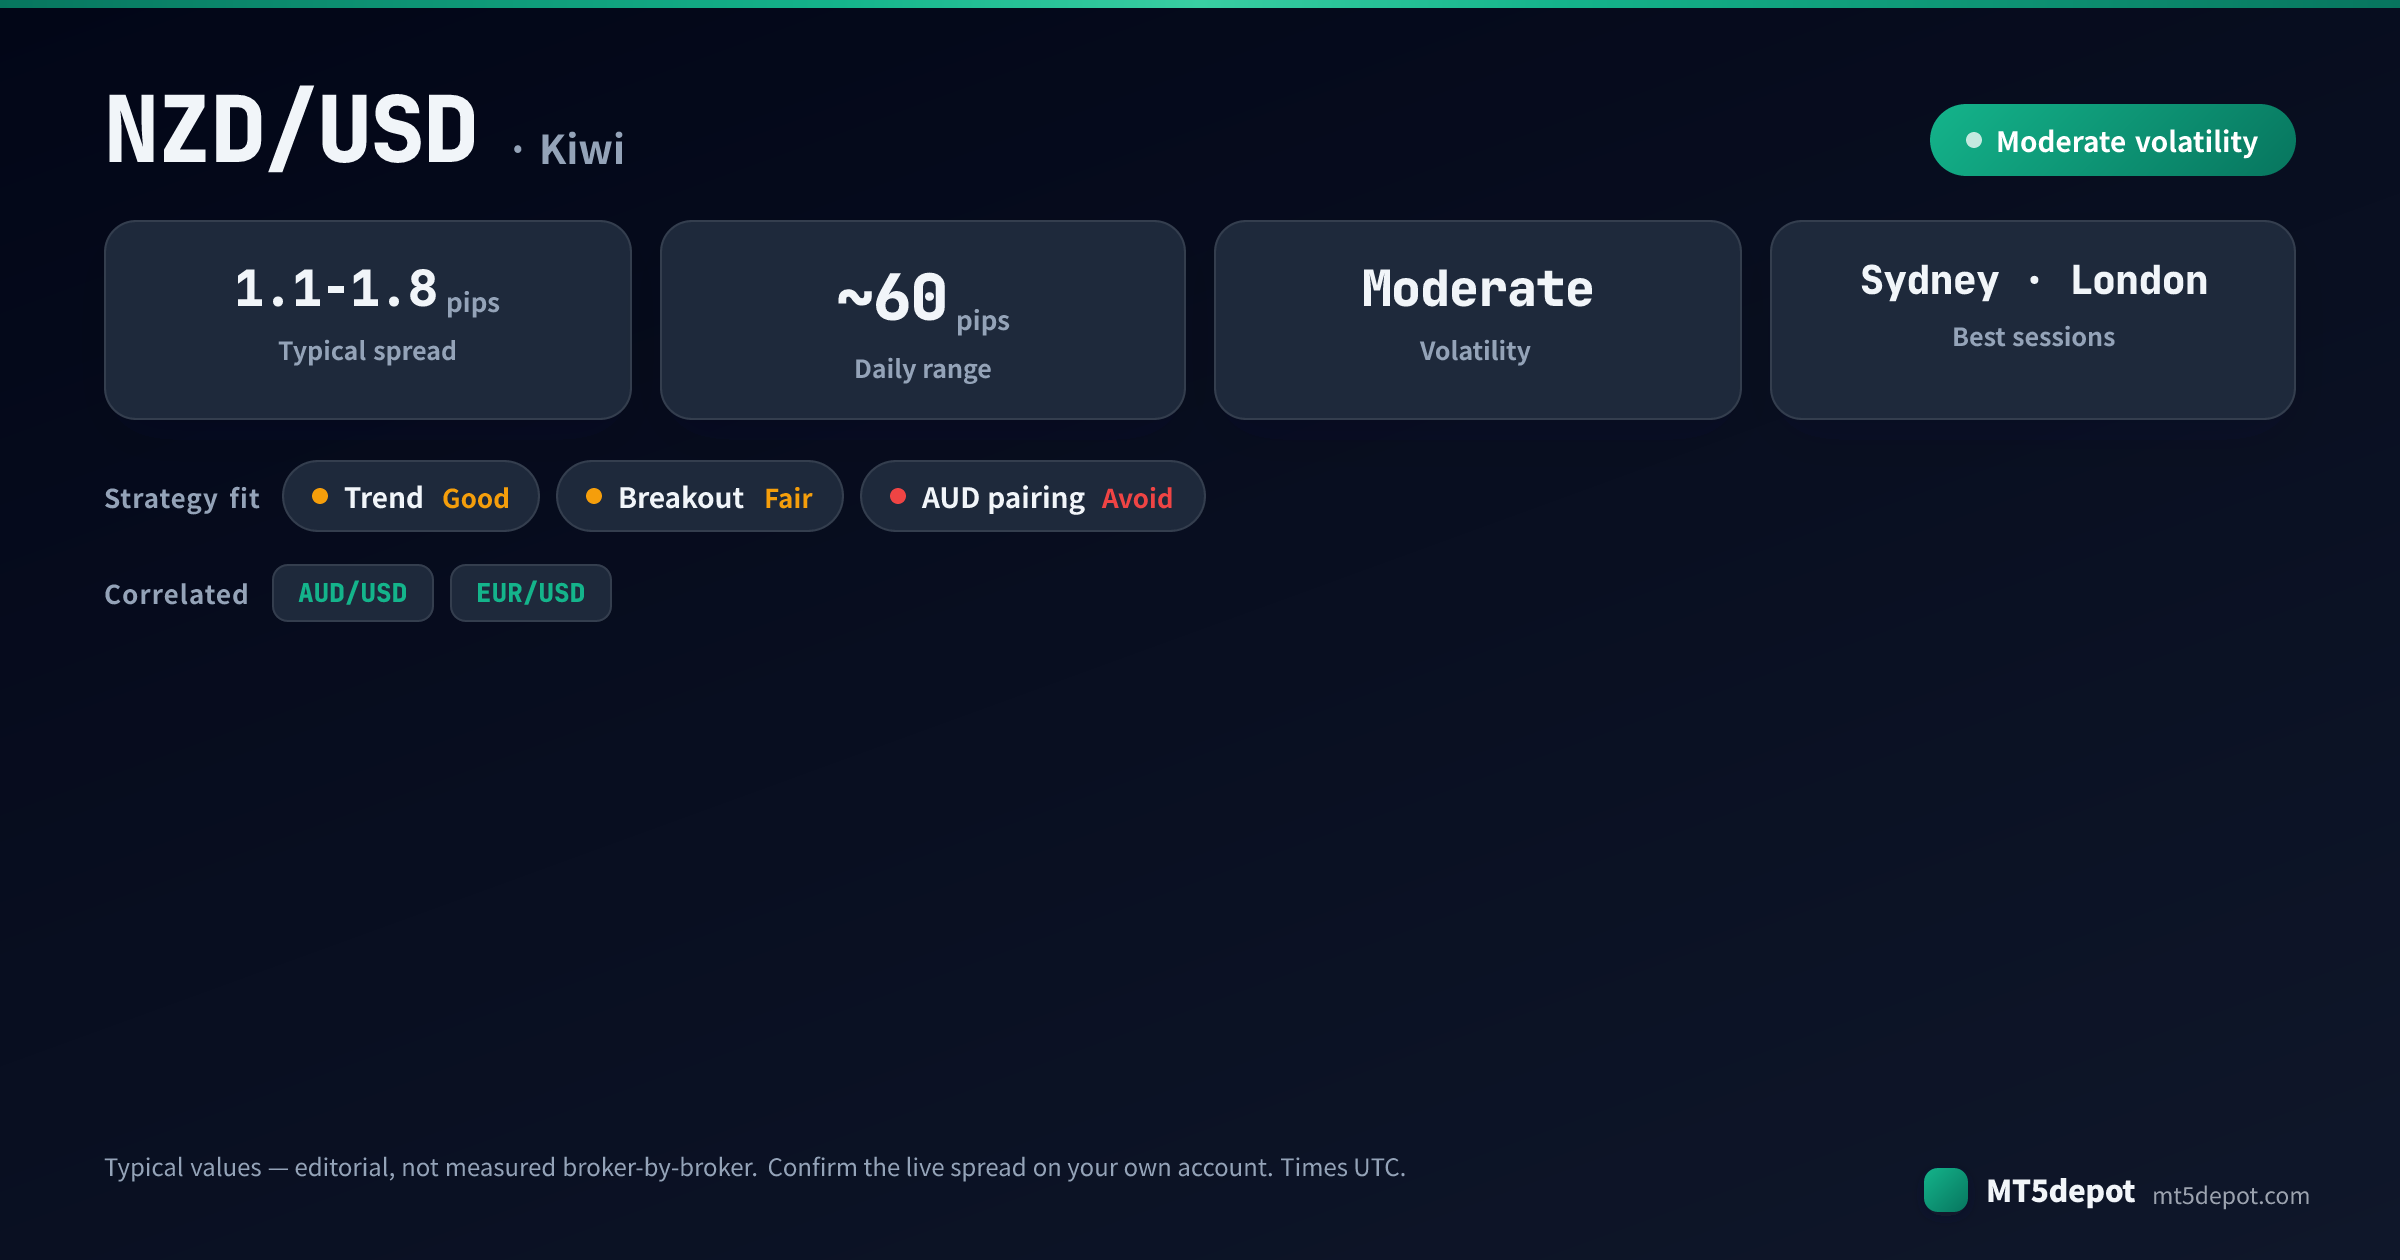
- Moderate range, thinner book. Our published typical daily range for NZD/USD is near 60 pips — labelled typical, not measured broker-by-broker — narrower than the volatile majors, which gives breakout systems smaller clean ranges to work with. Because it trades less volume, its relative spread is wider and its liquidity thins fast outside its home sessions.
- A live Wellington/Sydney open EUR/USD lacks. The Kiwi has real Asia-Pacific price action from around 21:00 UTC as Wellington and then Sydney come online — driven by NZ data and regional risk sentiment — where EUR/USD is effectively asleep. That is genuine signal for an Asia-Pacific EA, not just a quieter version of the London session.
- Near-twin correlation with the Aussie. The commonly-cited rolling correlation with AUD/USD sits around 0.85 (a typical band, not a measured figure). Both respond to the same commodity and China-demand cycle, so the Kiwi is best understood as one expression of a broader Australasian risk trade rather than an independent instrument.
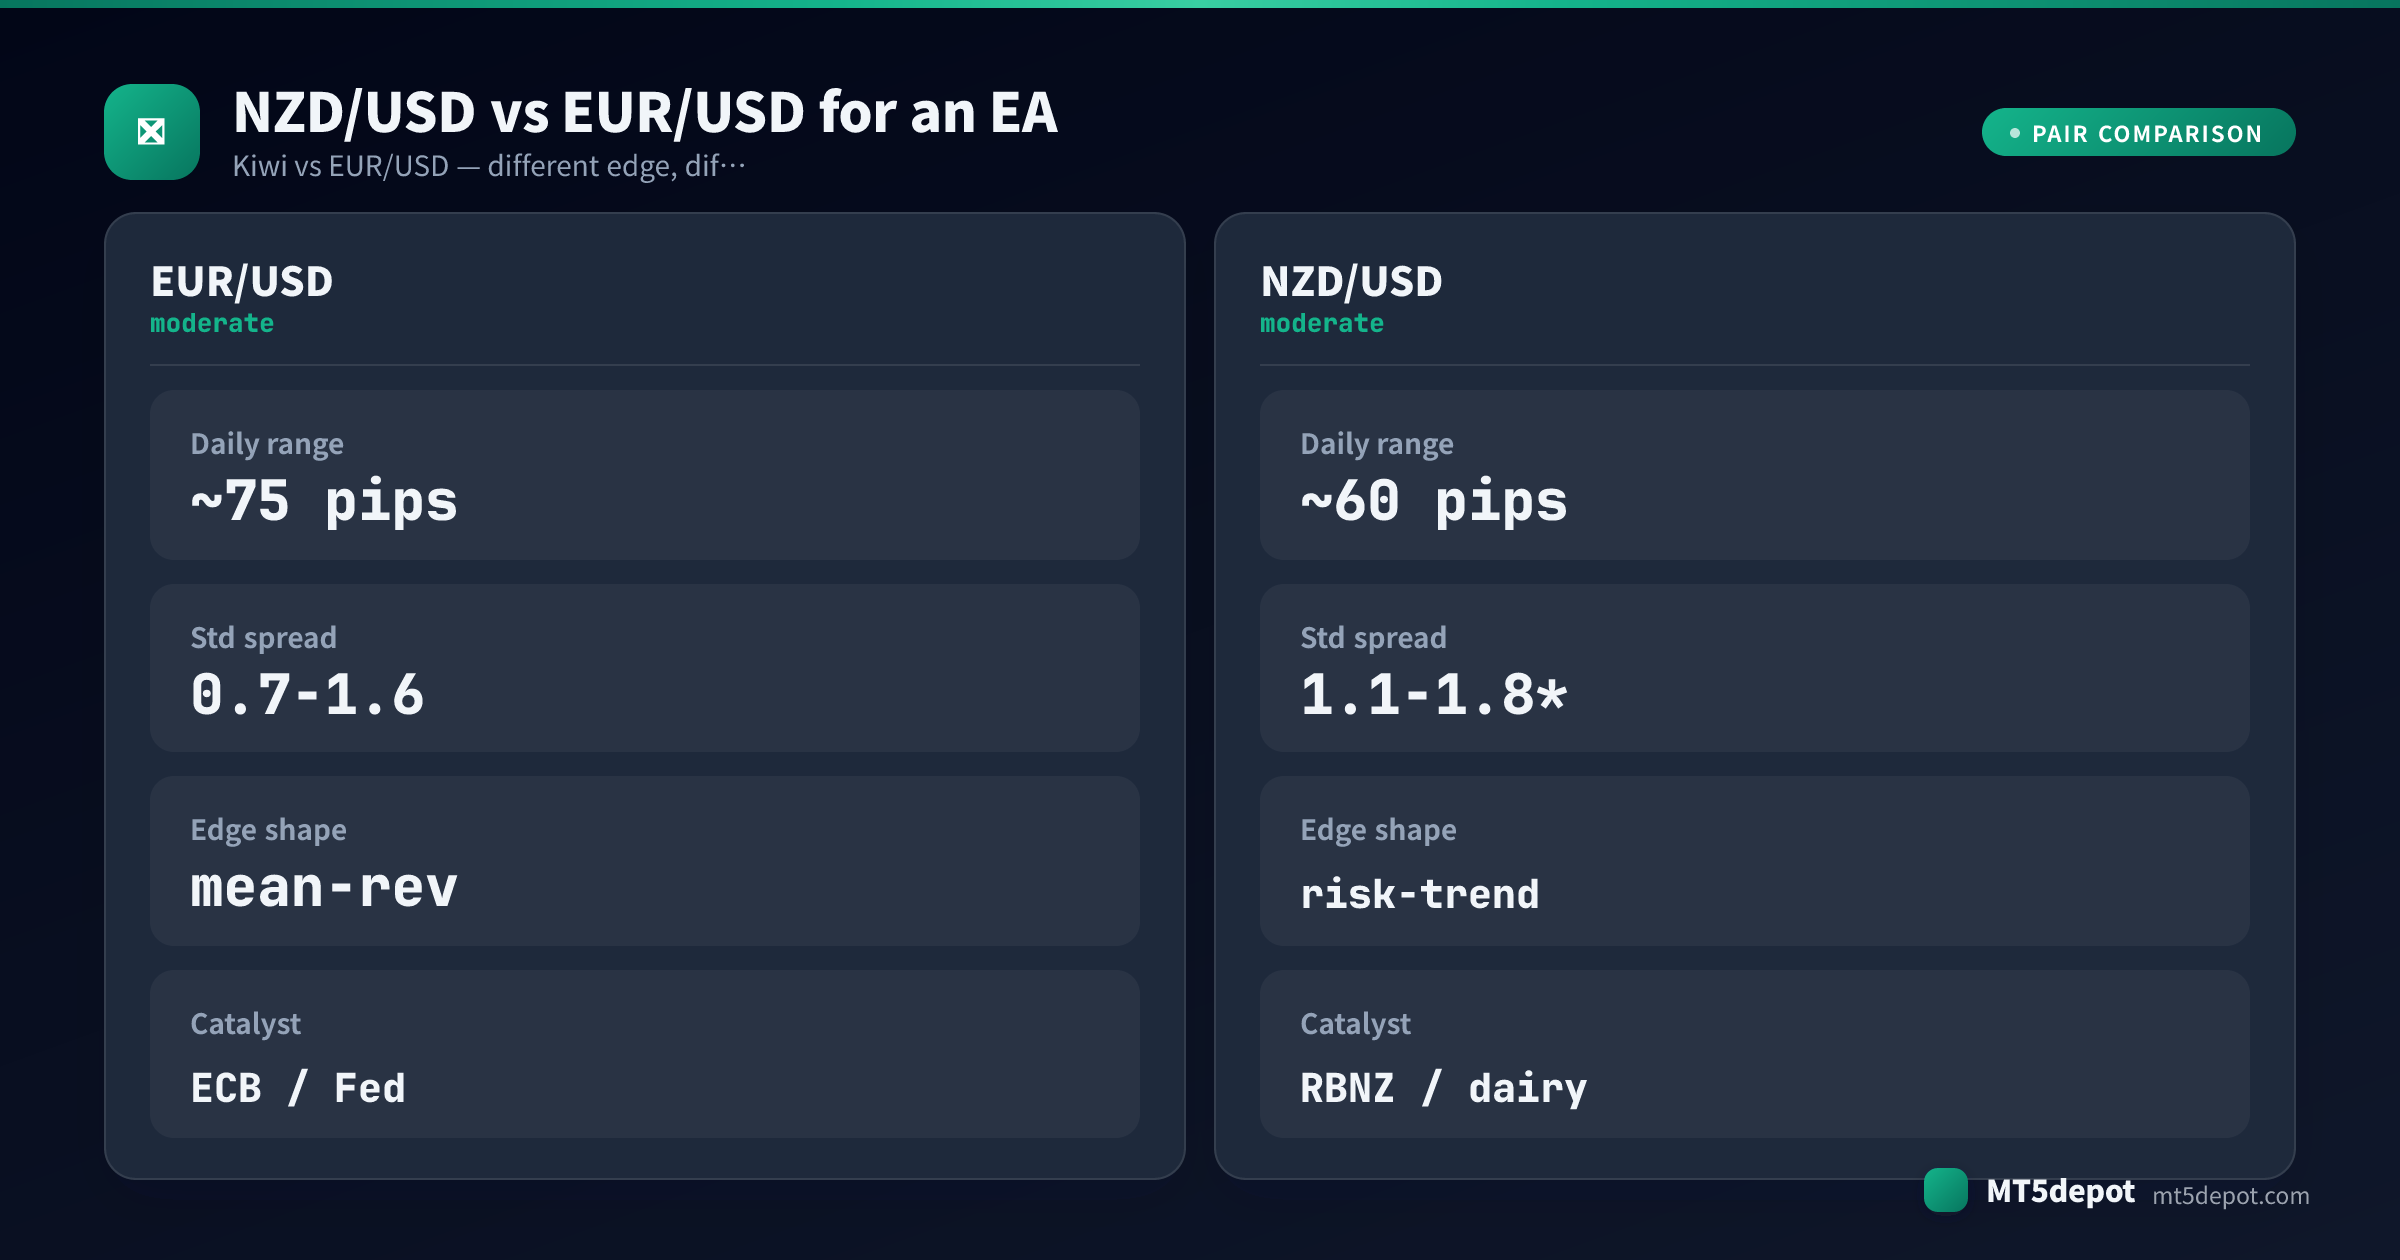
The trap for automated strategies is that the Kiwi looks like a clean, well-behaved major on a backtest until the thin liquidity and the correlation show their teeth in live trading. The spread widens on the data that matters most, and the Monday open can gap over weekend news. A book that pairs it with AUD/USD is running double commodity-risk exposure that appears nowhere in either EA’s settings.
Which EA Strategies Suit NZD/USD?
The pair’s profile lists trend and breakout as suitable — but suitability is not proof. In our own stock-settings baseline of the Builder’s templates — a single USD/JPY M5 run over one year, default inputs, no optimisation — most finished below a 1.0 profit factor, and that run was not on NZD/USD. Almost none cleared the Builder’s own bar at stock settings, so treat any edge on NZD/USD as something your own settings and test have to earn — through mechanics rather than the indicator on the box. What Kiwi’s character supports specifically, in our editorial assessment:
| Strategy | Fit on Kiwi | Why |
|---|---|---|
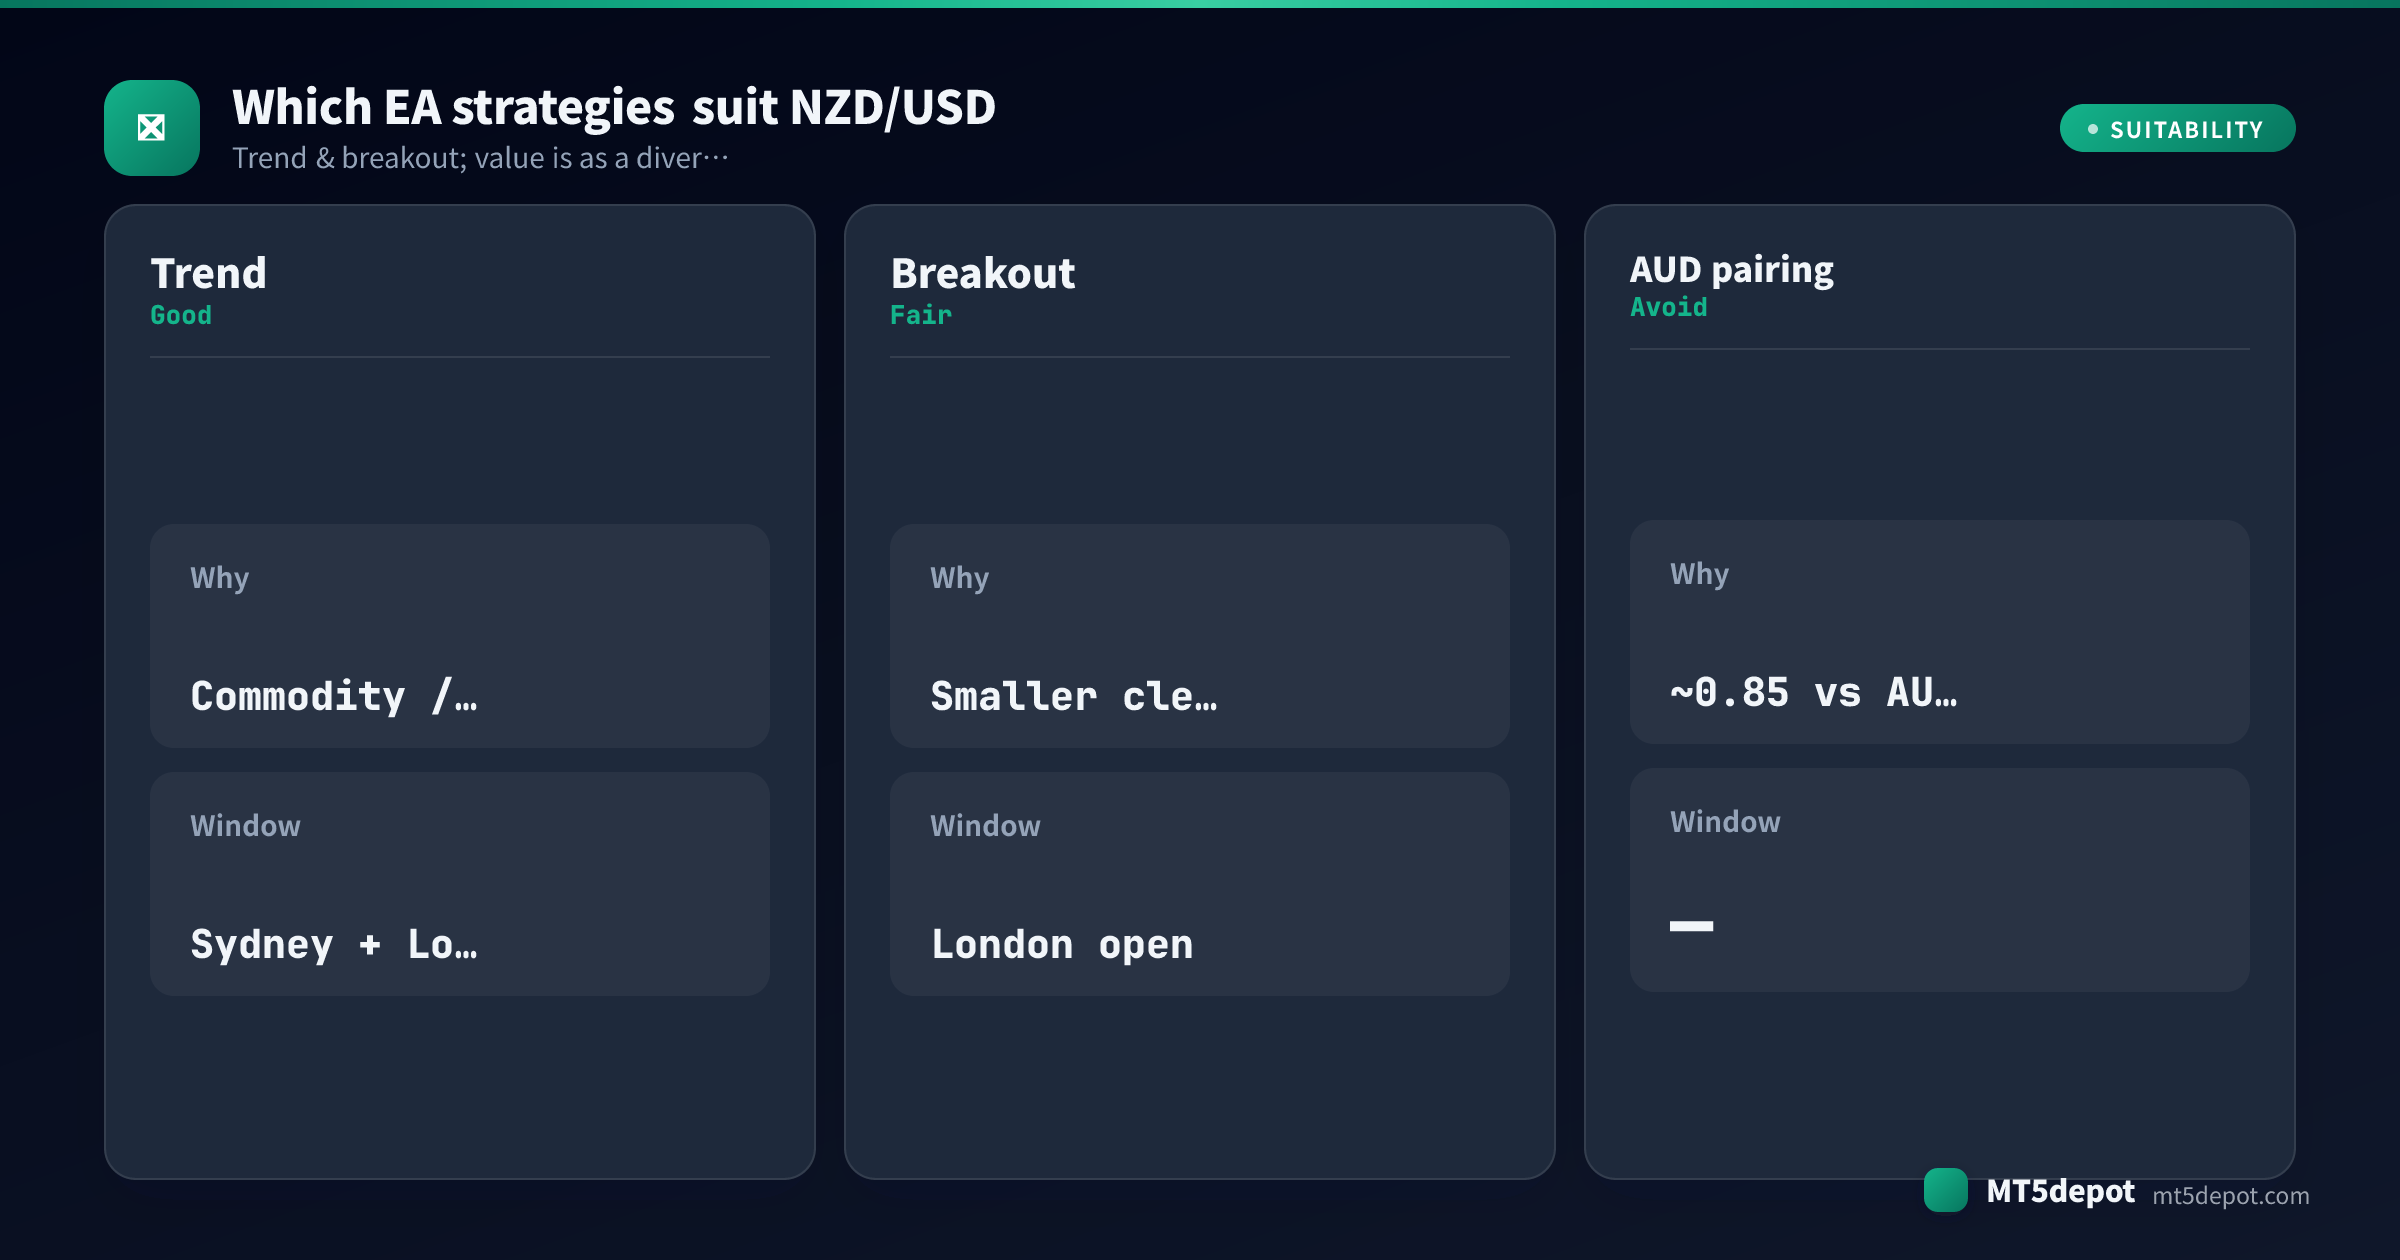
| Trend-following | Good | Commodity and risk-on/risk-off cycles produce sustained directional moves. Trading them through the Sydney and London windows is the natural way to use the pair’s character. |
| Breakout (pending orders) | Fair | The ranges are cleaner but smaller than the volatile majors, so a breakout system has less room per trade. Pending-order entries at the London open are less spread-sensitive, which matters on a wider-spread pair. |
| AUD pairing / basket | Avoid | Running NZD/USD as a “diversifying” leg next to AUD/USD is the one shape to avoid. A ~0.85 correlation means the basket is roughly one leveraged commodity-risk position, not a hedge. |
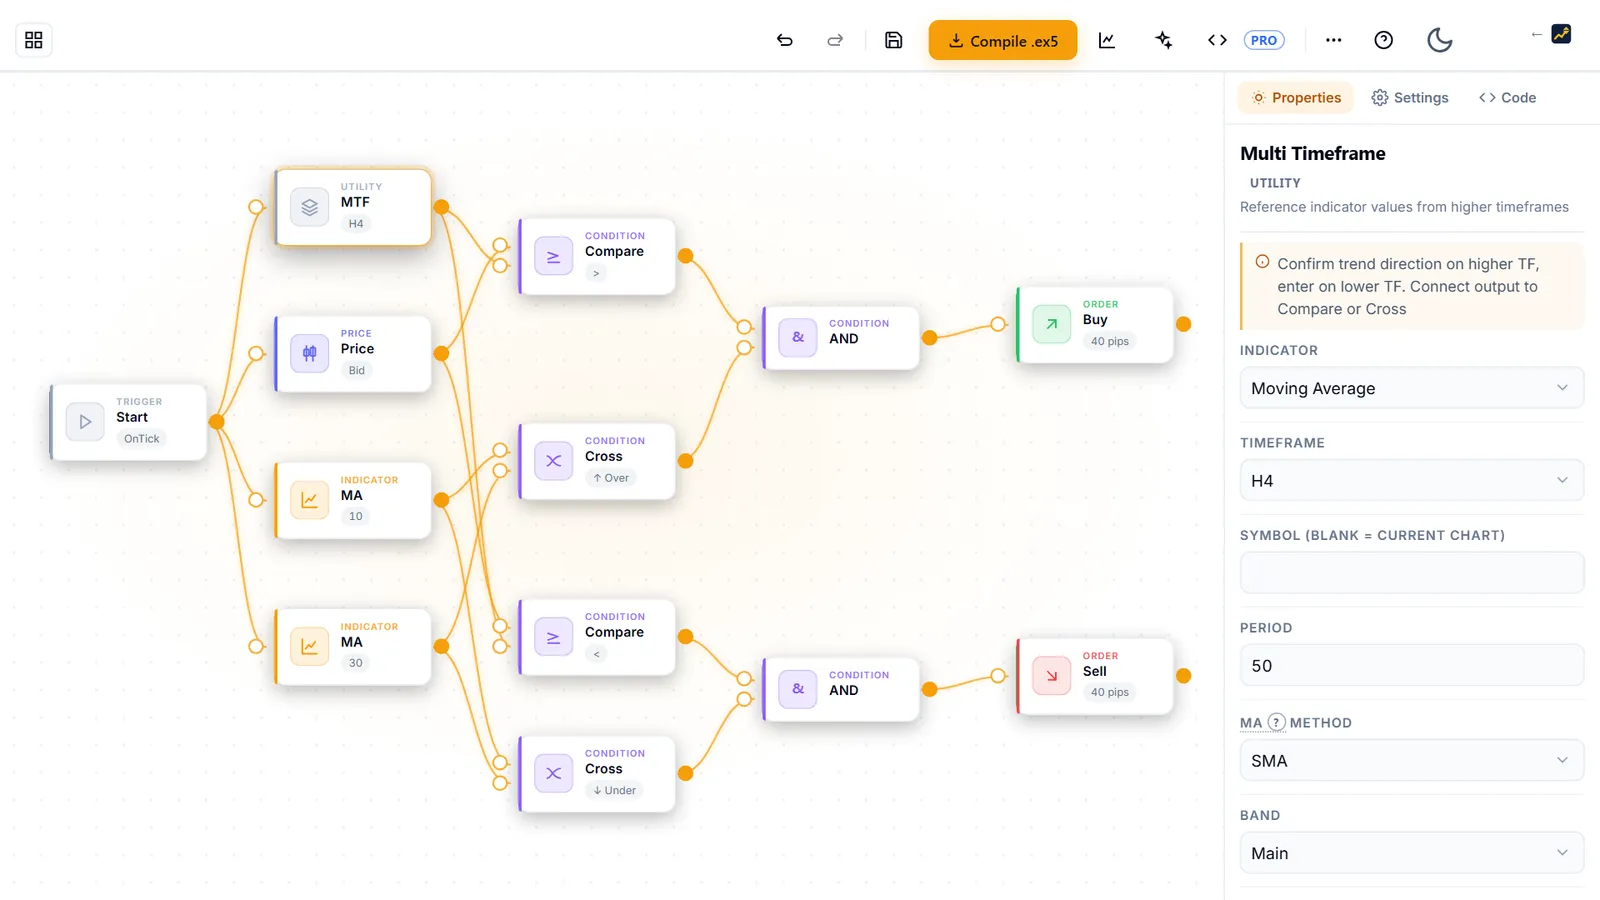
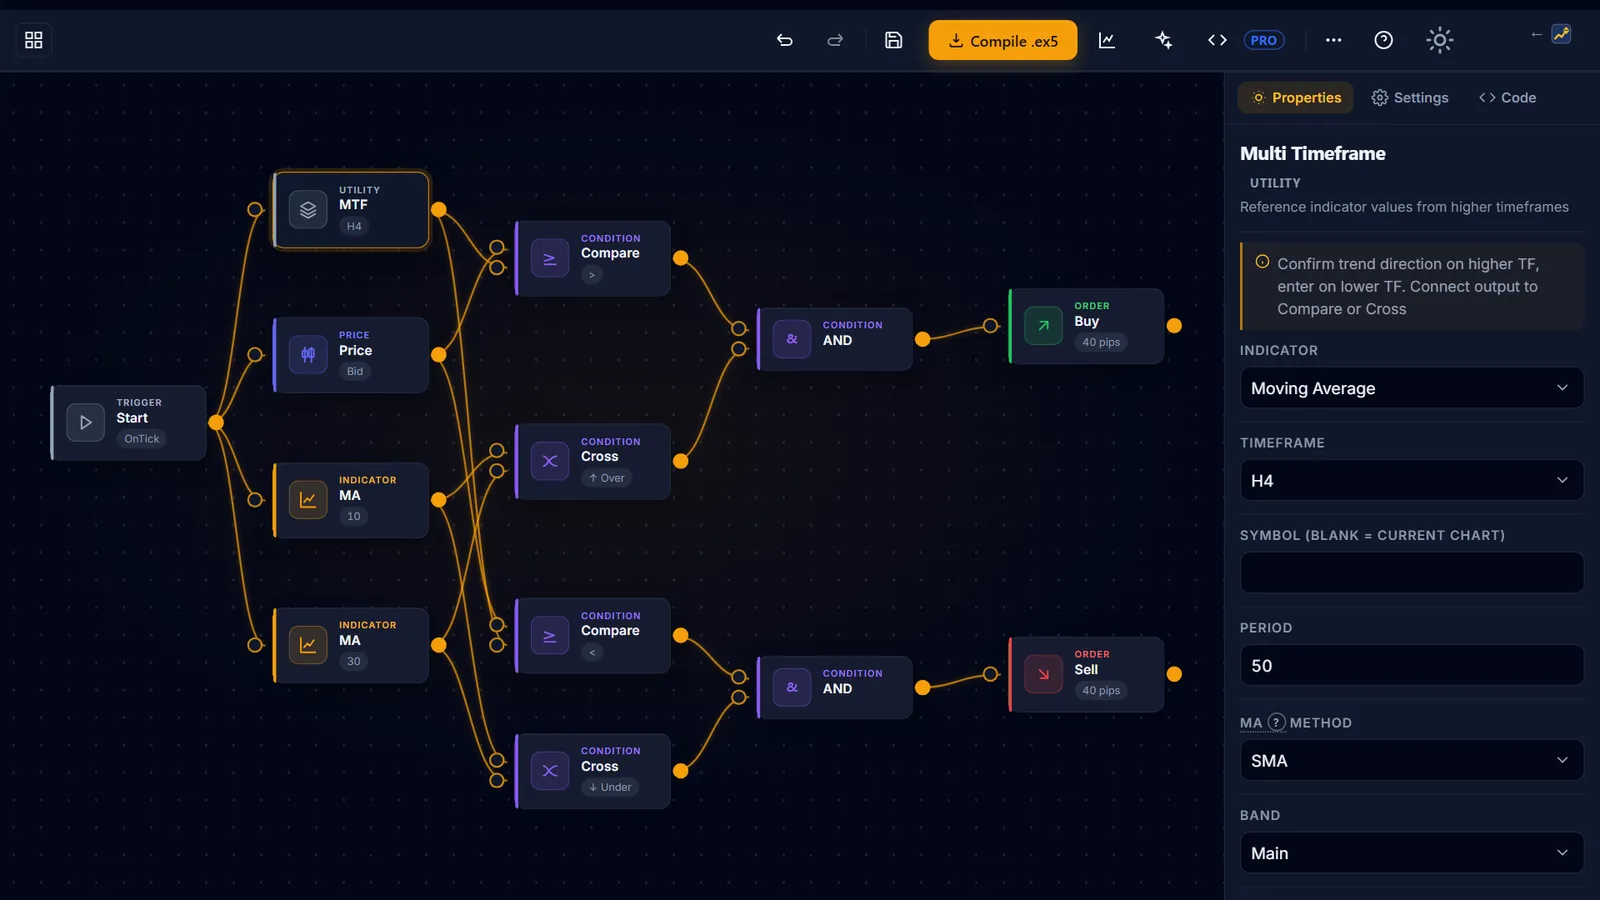
Trend is the shape that turns the Kiwi’s risk-cycle character into an asset; breakout works but on smaller ranges; the AUD pairing is a trap dressed as diversification. The practical route is to build one of these shapes yourself. The Builder ships templates that accept NZD/USD and exposes every parameter. Test it (below) before you trust a single number.
Best Trading Hours for NZD/USD EAs
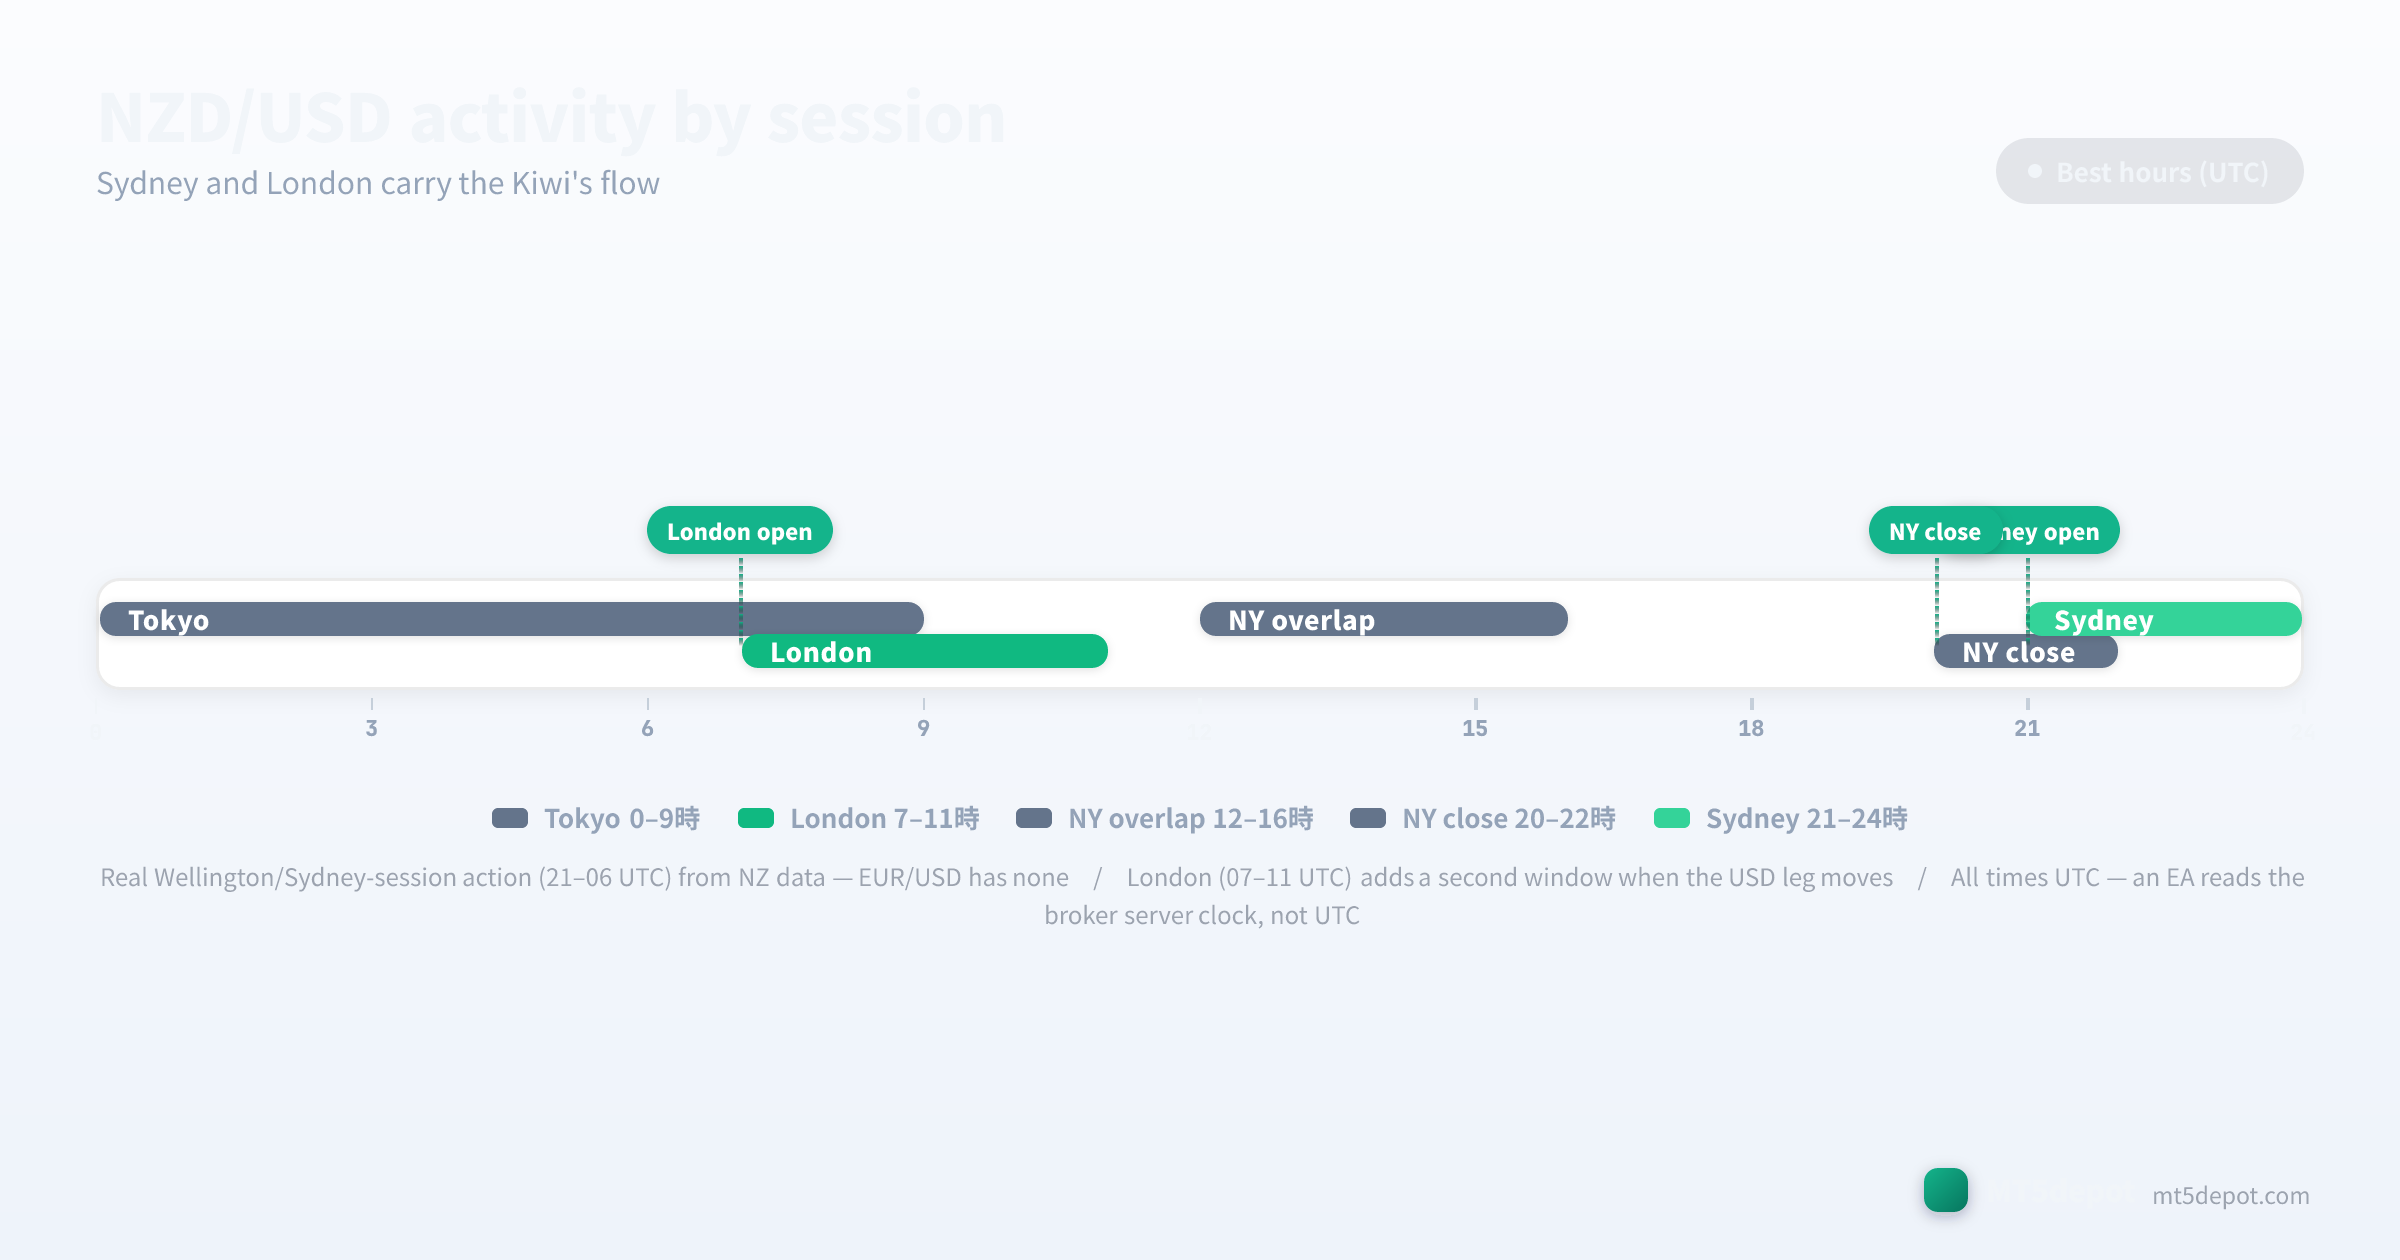
Session structure decides more of a Kiwi result than indicator choice does, and unlike EUR/USD the pair’s best window opens in the Asia-Pacific hours:
- Wellington / Sydney open (21:00–06:00 UTC): the Kiwi’s home window and its real advantage over EUR/USD. NZ data and regional risk sentiment drive genuine price action here from the moment Wellington comes online, with Sydney depth arriving as the session builds. Asia-Pacific trend EAs find their cleanest signal in this window.
- London open (07:00–11:00 UTC): the secondary window, when the USD leg starts moving and European flow adds momentum. Breakout systems targeting the London-open range often concentrate their entries here.
- NY hours (12:00–20:00 UTC): US data can jolt the dollar leg. But the Kiwi’s own liquidity thins as its home session closes, so late-day moves are more prone to whipsaw and are worth filtering out of a session-gated strategy.
Two cautions come with the schedule. The early-Wellington open is exactly where the thin-liquidity Monday gap lives — see the risks below. A strategy that trades the open needs to survive a gap, not assume a continuous price. And every clock time above is UTC. An EA reads your broker’s server clock, which is usually not UTC, so a “21:00” filter shifts silently when you move the EA between brokers on different server timezones. This is the one clock rule for the whole page. Verify it once in MT5’s Market Watch, and every session boundary lines up.
Spreads, Costs, and Execution
NZD/USD is more expensive to trade than EUR/USD, and the reason is structural: it trades less volume, so the same order moves the spread further. The figures below are editorial reference ranges compiled from broker-published standard and raw conditions (updated July 2026), not broker-by-broker measured numbers; our live spread sampling currently covers EUR/USD and a few reference symbols. Confirm the live spread on your own account before you size a fast strategy:
| Account type | Typical NZD/USD spread | Commission | Who it suits |
|---|---|---|---|
| Standard | 1.1 – 1.8 pips | none | swing / low-frequency trend EAs |
| Raw / ECN | ≈0.3 – 0.7 pips | $3 – 7 / lot | breakout / higher-frequency EAs |
Two cost rules specific to this pair:
- Budget wider than EUR/USD, and confirm on your own account. The Kiwi’s thinner liquidity means its standard spread typically runs in the 1.1–1.8 range above, wider than the tightest EUR/USD conditions on offer. That extra width is a rounding error for a swing EA and a recurring tax for a higher-frequency one. Faster NZD/USD systems therefore belong on raw-type accounts where the spread compresses to a known number. Watch the swap too. The Kiwi’s carry can be meaningfully positive or negative depending on the rate gap, and a trend EA that holds positions overnight pays or earns it every day.
- The commission is an account property, not a pair property. The same $3–7/lot raw commission applies whether you trade EUR/USD or the Kiwi; what changes between pairs is the spread on top of it. An NZD/USD breakout system validated at 0.5 pips all-in and deployed at 1.8 is running a different strategy from the one you tested.
Risks to Test Before Going Live
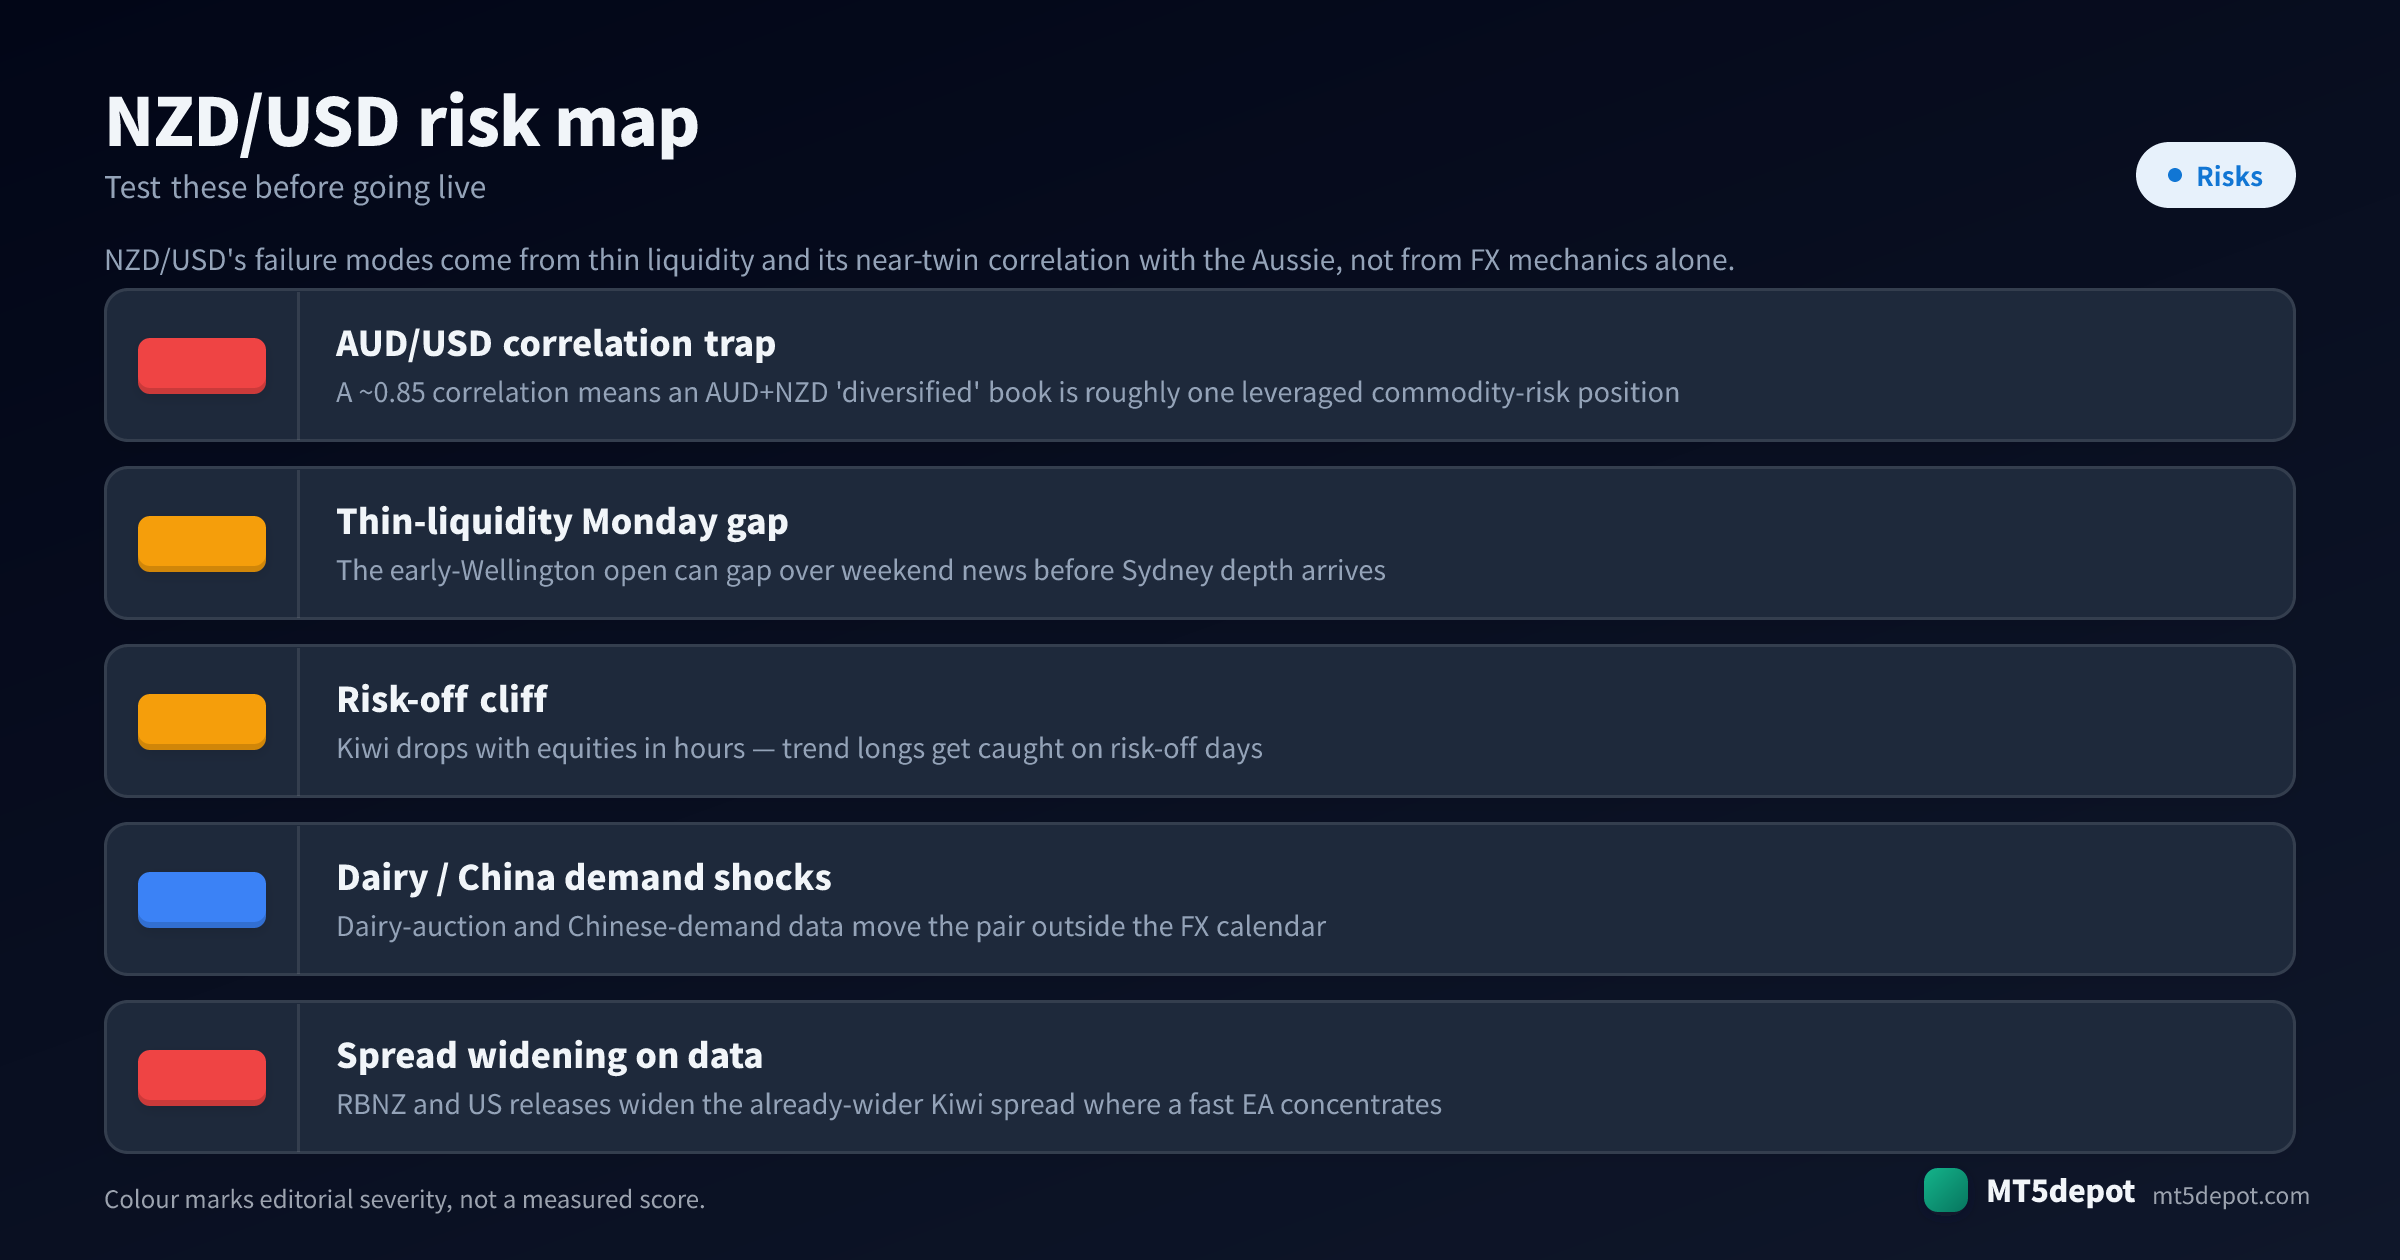
The Kiwi’s failure modes come from thin liquidity and its near-twin correlation with the Aussie, not from FX mechanics alone, so a generic risk checklist misses them:
- The AUD/USD correlation trap. A ~0.85 correlation means an AUD+NZD “diversified” book is roughly one leveraged commodity-risk position. The two legs move together, so you have doubled your exposure without it appearing anywhere in either EA’s risk settings. Never run NZD/USD long alongside an AUD/USD long and call it diversification. The same NZD leg also sits inside NZD/JPY, where a risk-off move hits the commodity currency and the yen cross at once — adding that cross beside NZD/USD compounds the exposure rather than spreading it.
- The thin-liquidity Monday gap. The early-Wellington open can gap over weekend news before Sydney depth arrives, so a strategy that trades or holds through the weekly open has to survive a price jump rather than assume continuity. Test explicitly through a Monday open — the Wellington gap is a recurring hazard, not a tail event.
- The risk-off cliff. The Kiwi falls with equities in hours on risk-off days, the same way the Aussie does. A trend EA that is long into a risk-off session gets caught, so a risk-off filter — not just a technical stop — is part of the strategy definition here.
- Dairy and China-demand shocks. Dairy-auction results and Chinese-demand data move the pair outside the FX calendar, which means a news filter keyed only to scheduled RBNZ and US releases will miss catalysts that still gap the price.
- Spread widening on data. RBNZ and US releases widen the already-wider Kiwi spread exactly when a fast EA concentrates its trades. A high-frequency system needs a news pause, or it pays a multiple of its tested cost at the worst moment.
How to Test a NZD/USD EA
On NZD/USD, the test is the whole edge. Hold anything you build to the bar set out in the site’s methodology:
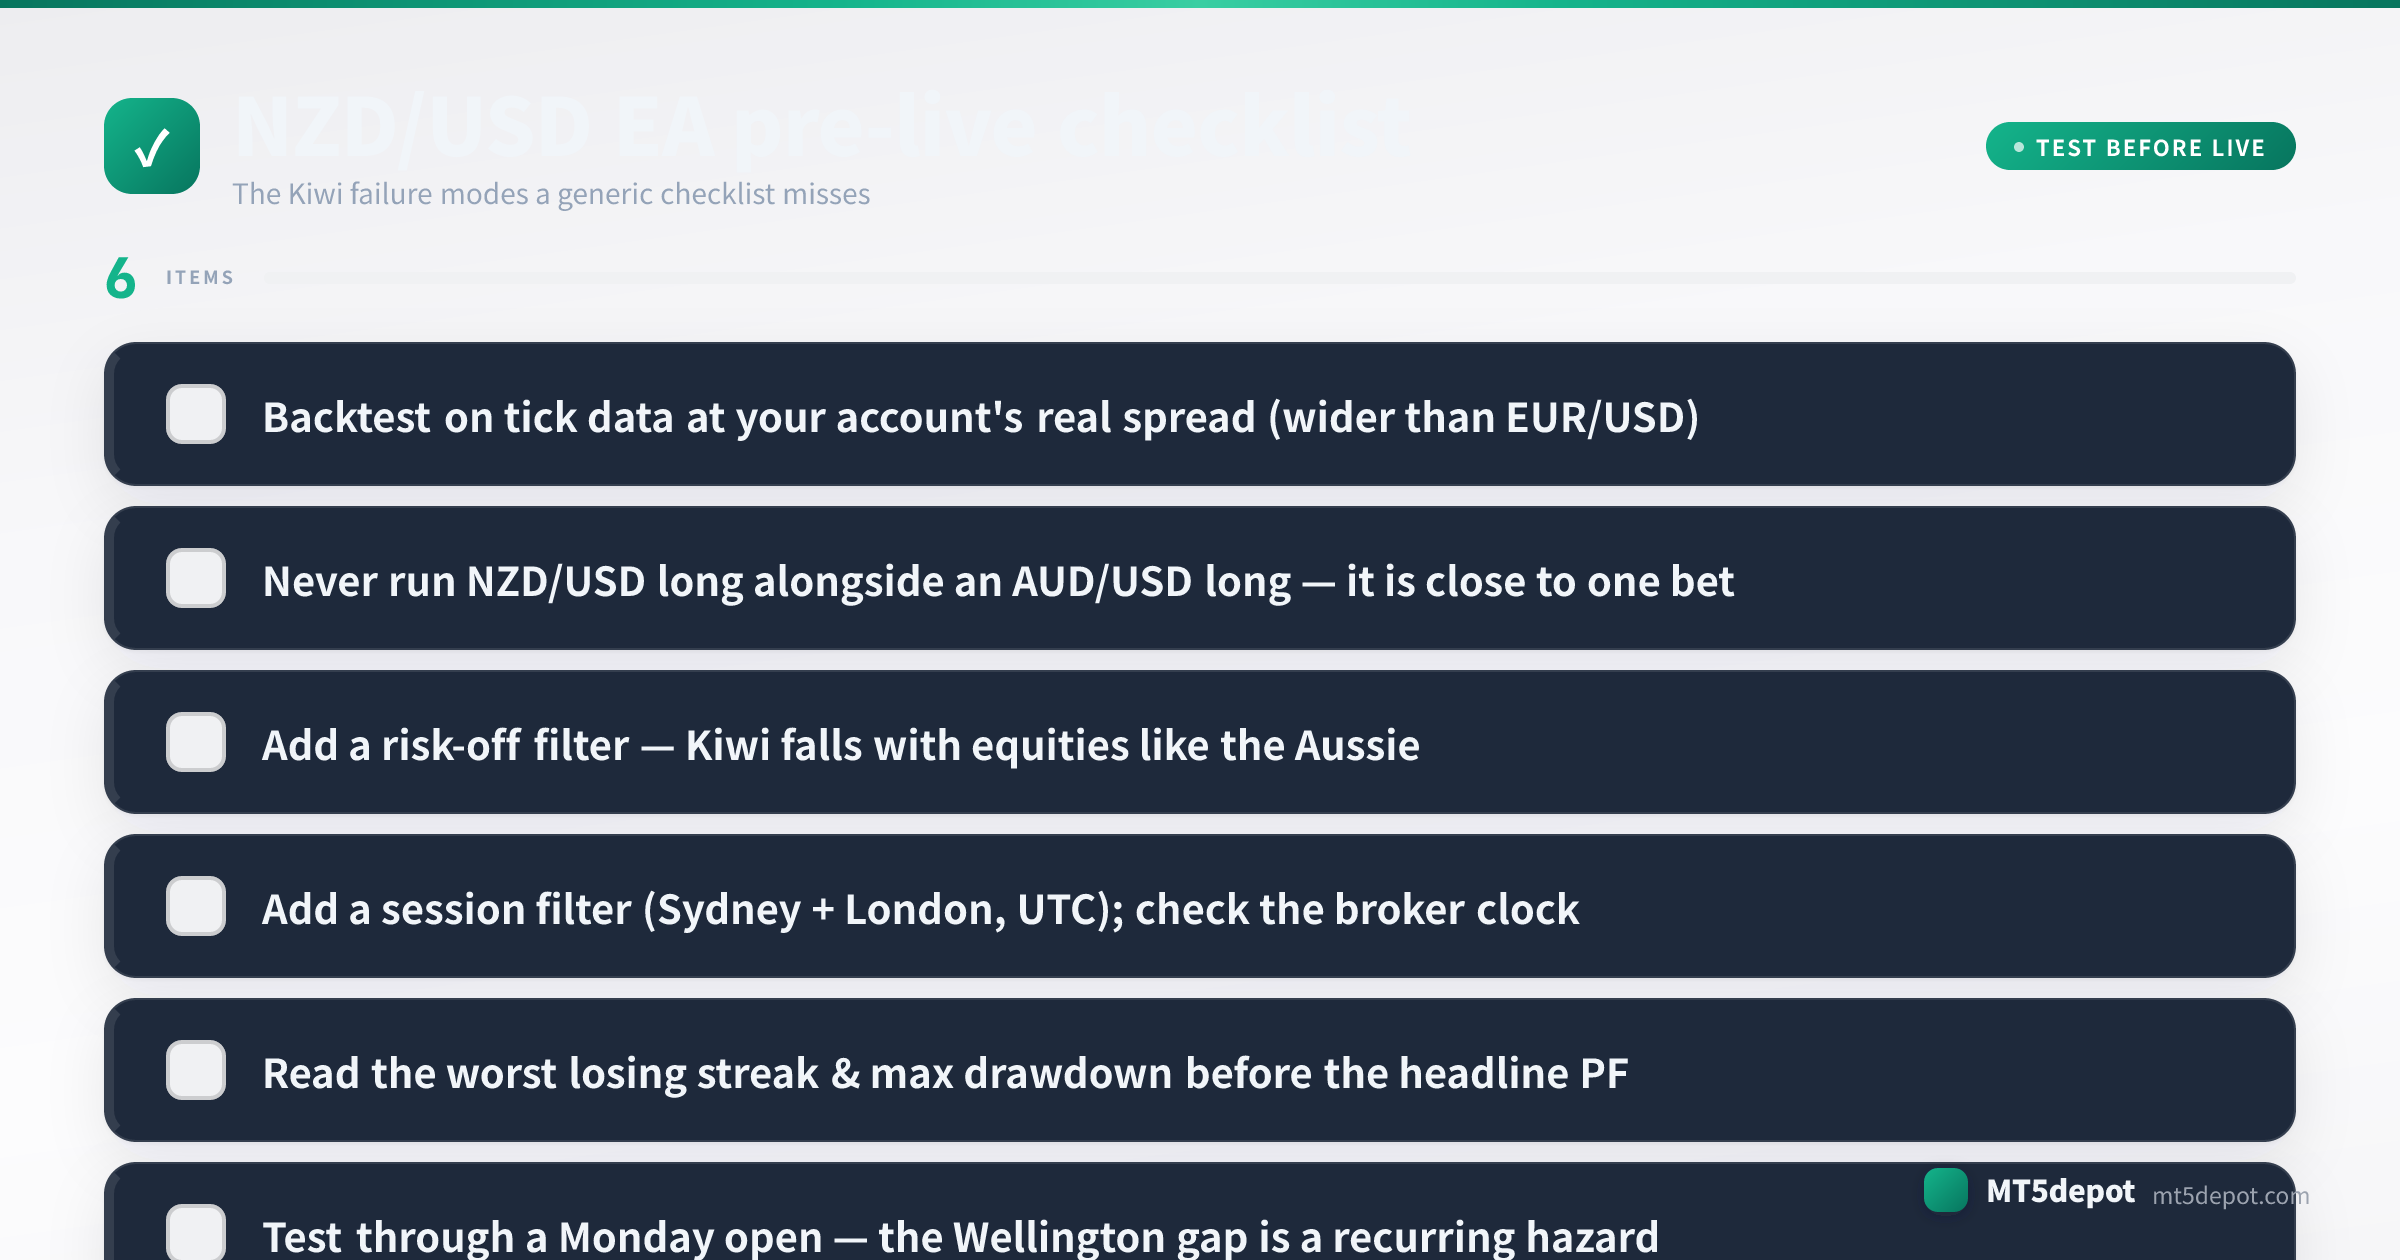
- Backtest on tick data at your account’s real spread. Use an every-tick model with the standard-or-raw spread you will actually trade — wider than EUR/USD — not the platform default. A Kiwi strategy validated at a spread it will never see is a fiction, and this is where the typical-vs-measured gap above becomes real money.
- Read the worst losing streak, not the headline profit factor. The max drawdown and the longest run of losing trades tell you the capital and the patience the strategy demands. Budget for the worst streak before you fund it.
- Forward-test on demo through at least one catalyst — and one Monday open. The Kiwi’s defining risks only show up around RBNZ or dairy/China-demand data and at the weekly open. A demo window that never spans a rate decision or a Monday gap has not tested the things that matter most.
- Confirm the server clock before the first live trade. Re-check MT5’s Market Watch time against the UTC session hours above, and re-check it again after any broker migration. That step is easy to skip and expensive to miss when your best window opens in the Asia-Pacific hours.
Every backtest number this produces is a historical measurement, not a forecast — say so in your own notes, and size for the drawdown you measured rather than the return you hope for.
NZD/USD EAs and Builder Templates
We have not published an NZD/USD backtest of our own, and a result from EUR/USD does not carry over to the Kiwi’s thinner book, wider spread and Monday-open gap. The honest route to an NZD/USD EA is to build and verify one:
- The Builder (open it here) accepts NZD/USD in its trend and breakout templates. The EA you deploy is built on your own numbers, and the CTA below covers exactly what it produces.
- The record to keep. Write down your Kiwi build’s worst losing streak and max drawdown from the backtest, not its headline return. That is the record a live run should be compared against, and the first thing to check if the EA starts to struggle.
- The concept canonicals. If a term above is unfamiliar, the spread, volatility and swap entries define the mechanics an NZD/USD EA depends on.