Trend
Trend-following EAs enter in the direction of an established move and stay in while it lasts. The entry decides when they trade; the exit decides what the record looks like. In the Builder's own stock-settings baseline, the same entry scored 0.97 with a fixed stop and target and 0.65 with a trailing-stop exit package.
At a glance
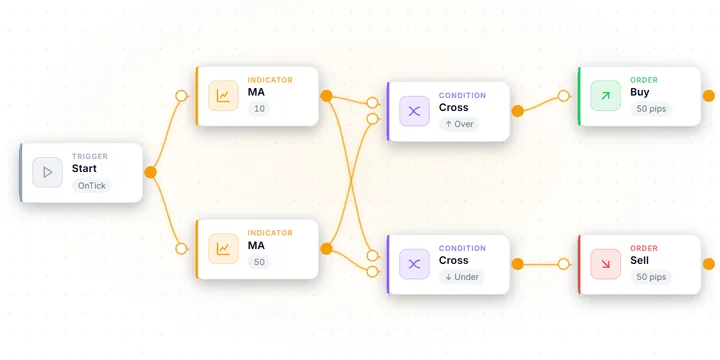
How a trend EA trades
The entry decides when it trades. The exit decides what the record looks like.
At a glance
Win rate needed to break even
Before costs, break-even win rate = 1 ÷ (1 + payoff ratio). A fixed 2:1 target-to-stop breaks even at 33.3%.
Mechanism
A trend EA confirms direction with a moving-average relationship, a channel or ATR-band break, or a momentum reading past a threshold, then enters with the move and manages the position until the trend ends. The exit is what varies most: a trailing stop or signal reversal holds winners open for as long as the move runs, while a fixed take-profit closes them at a set distance. Position size is fixed or scaled to ATR or to a risk percentage, and on H1 or H4 trade frequency is low — a few trades a month per symbol.
Suitability
Best where moves persist for many bars: major FX on H1 and H4, index CFDs, and macro-driven metals or crypto. Hostile to range-bound conditions, where entries are triggered by moves that immediately fold back, and to low timeframes, where the average move is small next to spread. Cost per trade matters less than for scalping because holds are long, but overnight swap becomes a real expense on multi-day positions. Suitable for a trader who can leave positions alone for hours or days and sit through a losing streak without switching the EA off.
Notes
Trend-following is the oldest systematic edge that still works, and the one most often misdescribed. The mechanism is not a forecast: the EA waits until a direction is already established, joins it, and stays in while the condition that identified it persists. The money is made by holding, which is also why it is the hardest strategy for a human to run manually and the most natural one to hand to an expert advisor.
The usual description — trend systems lose most of their trades and make it back on a few big winners — is a claim about the exit, not about the entry. This page covers how a trend EA is built inside MetaTrader 5 and what the Builder’s measured trend templates show when the exit changes. It ends with how to stress-test one before any capital is exposed.
How it works: an entry that follows, an exit that decides
The entry side is well-travelled and largely interchangeable. Three constructions cover most trend EAs:
- Moving-average relationship. A fast average crossing a slow one, or price holding above an average. Cheap to compute, late by construction.
- Channel or ATR-band break. Entry when price closes beyond the highest high of n bars or beyond an ATR band around a mean. This scales the trigger to current volatility instead of a fixed pip distance.
- Momentum threshold. A directional oscillator past a level, usually combined with a higher-timeframe filter so the EA does not take a momentum reading inside a range.
The exit is where trend EAs actually differ. Expectancy per trade is win rate × average win − (1 − win rate) × average loss, and once an exit rule is fixed the two terms stop being independent. A trailing exit keeps winners open while the move continues: the average win rises and the win rate falls, because noise takes many trades out early. A fixed take-profit does the reverse.
A fixed 2:1 target-to-stop, which every fixed-exit trend template in the Builder uses at stock settings, breaks even at a 33.3% win rate before costs. A 40% win rate is comfortable at 2:1 and fatal at 1:1.
What the Builder’s trend templates show at stock settings
The EA Builder prints a measured baseline on the template cards that have one. Fifteen of its moving-average, Ichimoku, Alligator, ADX and oscillator-direction trend templates do; the breakout templates are covered on the breakout page. In our own stock-settings baseline of the Builder’s templates — a single USD/JPY M5 run over one year, default inputs, no optimisation — most finished below a 1.0 profit factor. The trend family is no exception.
| Test conditions | |
|---|---|
| Source | Baseline printed on each template card in the EA Builder |
| Symbol / timeframe | USD/JPY M5 (Exness MT5) |
| Period | 2025-06-01 – 2026-06-09 |
| Model | M1 OHLC (bar-level, not real ticks) |
| Deposit / inputs | 10,000, template defaults, no optimisation |
| Re-measured | RSI Scale-Out + Trailing on 2026-09-19 after a fix: same window, another USD/JPY account, fixed 20-point spread |
| Template | Entry | Exit at stock settings | Profit factor | Trades |
|---|---|---|---|---|
| Perfect Order Trend | EMA 5 > 20 > 60 and RSI above 50, buys only | SL 40 / TP 80 | 1.07 | 305 |
| Multi-TF Oscillator Confluence | Three H4 oscillators agree + EMA cross | SL 50 / TP 100 | 1.04 | 187 |
| Ichimoku | Tenkan/Kijun cross | SL 60 / TP 120 | 1.03 | 318 |
| Multi-TF Trend | H4 SMA 50 side + EMA 10/30 cross | SL 50 / TP 100 | 0.97 | 251 |
| Alligator Cross | Lips/Teeth cross | SL 50 / TP 100 | 0.97 | 484 |
| ADX Trend | ADX above 25 + DI direction | SL 50 / TP 100 | 0.96 | 534 |
| MA Crossover | SMA 10/50 cross | SL 50 / TP 100 | 0.95 | 420 |
| RSI Scale-Out + Trailing | EMA 20/50 cross | Half closed at RSI 70/30, 30-pip trail on the rest | 1.00 | 657 |
| Stepped-Pitch Trailing Trend | EMA 10/30 cross | Stop locked in 20-pip steps | 0.77 | 467 |
| ATR Trend Follow (Risk%) | EMA 20/50 cross | Stop 2× ATR, target 3× ATR, 1% risk | 0.77 | 1,200 |
| Volatility-Adaptive SL Trend | EMA 10/30 cross | Stop 2× ATR capped at 60 pips, TP 150 | 0.68 | 708 |
| Multi-TF + Auto Lot + Trailing | H4 SMA 50 side + EMA 10/30 cross | SL 40 / TP 120 + 25-pip trail, 1% risk | 0.65 | 452 |
Three fixed-exit templates not shown (MA Slope Trend, Multi-TF ADX Filter, Multi-TF Ichimoku) score 0.92, 0.92 and 0.77. Three things follow, and none of them is the folklore.
A more elaborate exit did not rescue a weak entry. The ten fixed-exit trend templates have a median profit factor of 0.965. The five that trail, scale out or size the stop to ATR have a median of 0.77. The closest comparison is a pair with one entry. Multi-TF Trend and Multi-TF + Auto Lot + Trailing both take direction from an H4 SMA 50 and enter on an EMA 10/30 cross. With a fixed 50/100 exit the record is 0.97 over 251 trades. With a 25-pip trail, a 40/120 stop and target, 1% risk sizing and no spread filter, it is 0.65 over 452 trades. Several dials moved at once, so this does not isolate the trail. One plausible reading is a trail sitting inside the ordinary noise of an M5 chart: positions close sooner, more of them open, and each one pays the spread again.
The best template in the table still misses the Builder’s own bar. The Measure panel prints a pass bar of profit factor at least 1.2, at least 60 trades and drawdown no worse than 20%. The highest score here, Perfect Order Trend at 1.07, does not clear it. A template is a wired-up starting point.
Tuning the exit on one window does not transfer to the next. The Builder records a stop-and-target search for three trend templates on USD/JPY H1. Each was run over three windows: 2018–2021, 2022–2024 and January 2025 – June 2026. Ichimoku’s best in-sample setting scored 1.37 and fell to 0.89 out of sample and 0.80 on the earlier window. MA Crossover’s best H1 setting, 1.23, fell to 0.98 on the earlier window. ADX Trend peaked at 1.04 and fell to 0.91 and 0.80. None of the three produced a setting above 1.0 in all three periods.
Market conditions: when a trend EA wins and when it breaks
| Condition | Favourable for a trend EA | Hostile for a trend EA |
|---|---|---|
| Market state | Directional moves that persist over many bars | Range-bound chop that reverses at the edges |
| Volatility | Expanding, with follow-through after the signal | High but non-directional — large bars, no net move |
| Timeframe fit | Move size comfortably exceeds spread and slippage | Signal on a timeframe where cost eats the average move |
| Holding cost | Swap neutral or positive on the traded direction | Negative carry paid nightly on a multi-day hold |
| Event risk | Macro themes that extend an existing direction | A single event that reverses the direction cleanly |
The strategy’s bad environment is a directionless market. In a range, the entry fires again and again on moves that fold back, each paying entry cost plus the stop. This is the mirror image of how mean reversion fails: the two lose money in different weather.
The second condition is holding cost. A trend EA on H1 or H4 routinely holds winners for days, and every night in the position pays financing. A modest winner held for a week can hand a real share of its edge to swap while the signal works perfectly.
Parameters and settings in MT5
In the Builder, each of these is a block with its own inputs, and every value becomes an input in the compiled EA.
| Block and input | Typical starting point | What it controls |
|---|---|---|
Moving Average period / method | Long enough that the signal is a trend, not a wiggle | How much movement must accumulate before the EA calls a direction established |
| Multi Timeframe (e.g. H4 MA) | One step or two above the chart period | Keeps entries on the side of the higher-timeframe trend |
Stop Loss SL Mode = ATR multiple, ATR SL Cap (pips) | 1.5–2× ATR, capped so a volatility spike cannot blow the stop out | Stop distance in volatility units instead of fixed pips |
Trailing Stop Trailing Mode / Trail Distance / Step | Distance beyond the symbol’s normal pullback, or ATR mode | The whole payoff-versus-win-rate trade-off lives here |
Open Buy / Open Sell TP (pips) | A cap only if the exit is meant to be fixed | A non-zero target converts the record to higher win rate, smaller payoff |
Spread Filter Max Spread (points) | Just above the normal spread for the symbol | Blocks entry when the spread is abnormal |
OncePerBar (compiled input) | true for bar-close logic | Prevents the same signal firing repeatedly inside one bar |
Time Exit Friday close | On for multi-day holds if weekend gaps matter | Flattens before the weekend instead of carrying the gap |
The Trailing Stop block offers nine modes, including fixed distance, percent of open profit, moving average, high/low of the last N bars, ATR, Parabolic SAR and fractals. It moves only the stop: a trade that also has a TP still closes at the target, so a trail meant to run needs a wide target.
Three MT5-specific realities decide whether a promising backtest survives contact:
- Stops have a minimum distance. The broker rejects a trailing stop closer than
SYMBOL_TRADE_STOPS_LEVEL, and refuses a modification insideSYMBOL_TRADE_FREEZE_LEVEL. The EA the Builder generates checks both before modifying a position. An invalid level keeps the current stop, and a change inside the freeze zone waits for the next tick, so no request goes out that the server would reject. - Swap is a strategy cost, not a footnote.
SymbolInfoDouble(symbol, SYMBOL_SWAP_LONG)andSYMBOL_SWAP_SHORTare the values that apply to your account; triple-swap day differs by broker. A multi-day trend EA needs them in the test, not assumed away. - Bar-close logic must be tested the way it runs. An EA that evaluates once per bar behaves differently under “every tick” than under “open prices only”. The gap is largest where the trailing stop lives. Test on real tick history for the symbol you will trade, and read the modelling quality before the profit.
- Fix the entry rule and leave it alone — most of the difference you are about to measure comes from the exit, so changing both at once tells you nothing.
- Test the same entry with a trailing exit and with a fixed take-profit, and record win rate, payoff ratio and profit factor for each. The two records are the choice you are actually making.
- Size the stop in volatility units (ATR) rather than pips, and set any trail distance beyond the symbol’s normal pullback on that timeframe.
- Check the worst losing run in the resulting record and decide, before funding anything, whether you would sit through one twice as long.
- Recompute the result with swap included over the real holding period, and confirm the edge survives it.
Failure modes: how a trend EA loses money
- The market stops trending. Entries keep triggering on moves that fold back, and the account bleeds by stop-out. This is the normal way a trend EA loses, and it can persist for months while the strategy remains intact.
- The trail is tighter than the noise. A trailing stop set inside the symbol’s ordinary retracement converts winners into scratches. The profit factor falls without a single rule having failed — the exit simply removed the trades that pay for everything else. The 0.97-to-0.65 pair above is what this looks like in a record.
- The strategy survives the losing streak; the trader often does not. At a 33% win rate, nine consecutive losses is an ordinary run. Switching the EA off during one keeps every loss and forfeits the recovery. Read the worst streak before the drawdown, not during it.
- A record that rests on a handful of trades. When the top five trades are the whole profit, the backtest is a statement about those five trades, not about the rule. Check what the curve looks like with the best trades removed.
- Parameters fitted to one regime. Settings optimised over one directional period are the wrong length in the next — Ichimoku’s 1.37 falling to 0.89 is the pattern.
- Cost that only appears live. Swap on multi-day holds, weekend gaps, slippage on the stop — none of them shows up in an optimistic tester setup.
How to build and stress-test a trend EA in AIStrategyMiner
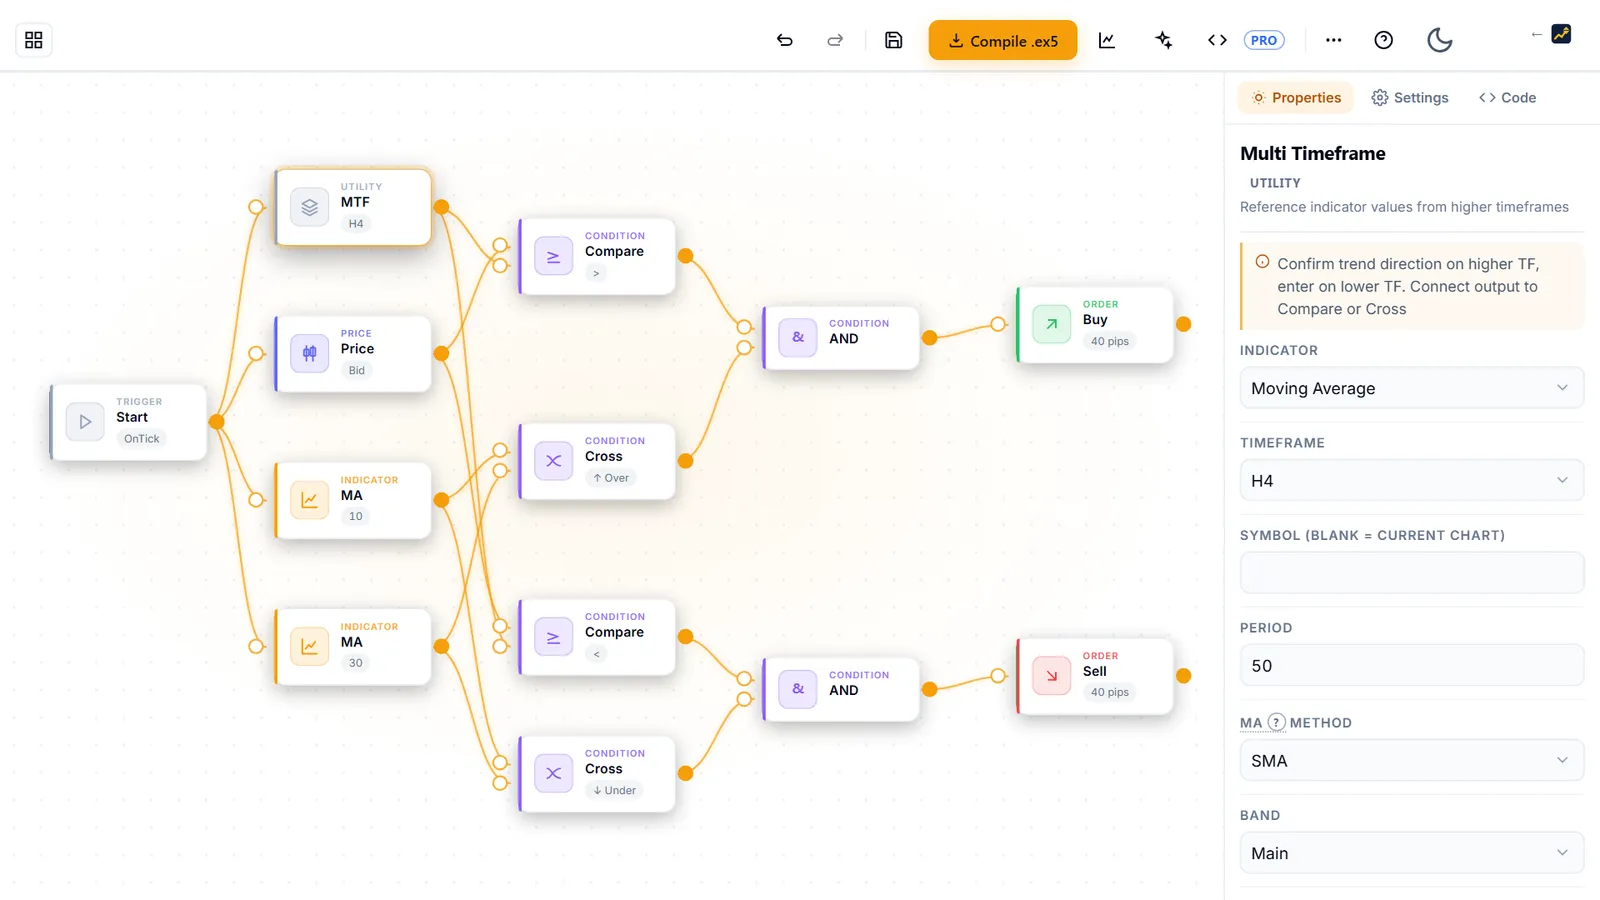
You do not need to write MQL5 to build the machine described above. A directional filter, an entry on confirmation, a volatility-scaled stop and a trailing exit are blocks in the no-code Builder, and the trend templates above arrive pre-wired. Load Multi-TF Trend, duplicate it, and change only the exit to a Trailing Stop block — unlike the template pair above, that isolates the trail on your own symbol and timeframe.
- Press Measure for the approximate check against the printed bar, then run the compiled EA in the MT5 Strategy Tester on real ticks.
- Recompute the record with its five best trades removed, and look at what is left.
- Hold back a window the tuning never saw, and keep only settings that stay above 1.0 in every window.
The .ex5 compiled from your own flow is free. The .mq5 source is part of Pro, a one-off purchase with no subscription — see pricing if you want to edit the generated code. The site’s methodology sets out how backtest results should be read.
Trend versus mean reversion
| Trend-following | Mean reversion | |
|---|---|---|
| What it assumes | An established direction continues | A stretched price returns to its average |
| Entry relative to the move | With it, after confirmation | Against it, at an extreme |
| Loses when | The market ranges and moves fold back | The market trends and the stretch keeps stretching |
| Typical exit | Trailing stop or signal reversal | Fixed target at the mean |
| Worst case | A long series of ordinary losses | One position held against a move that does not return |
| Complexity | Beginner — few inputs, hard to sit through | Intermediate — the exit and the stop carry the risk |
Neither is safer in general: one needs movement, the other needs stillness. That is an argument for running both, with one caveat the table cannot show. A trend EA with a fixed take-profit and a mean-reversion EA are not as different as their labels suggest, because both then depend on price stopping where the rule says it should. Check what each one’s exit actually does before assuming that holding two EAs has diversified anything.
Build a trend EA from blocks
A direction filter, an entry on confirmation and an exit are blocks in AIStrategyMiner Builder. Wire them together, change only the exit, and compare the two records on your own symbol, with no code.
- Compile a standard .ex5 file for MetaTrader 5 and test it on tick history before you rely on it.
Check the finished EA in MetaTrader 5 before you trust it. The numbers on this page come from what you typed; they are not a forecast of results.
Related articles
Frequently asked questions
- What is a trend-following EA?
- A trend-following EA identifies an established direction and opens with it rather than against it. The direction is usually read from a moving-average relationship, a channel or ATR-band break, or a momentum reading past a threshold. It then holds the position while the condition persists and closes on a trailing stop, a reversal of the signal, or a fixed target. It is simple to describe and hard to sit through, because the profitable version regularly spends weeks giving back open profit.
- Do trend-following EAs have a low win rate?
- Only if the exit makes them. The entry decides when a trend EA trades; the exit decides how often it wins. A trailing stop holds winners far longer than losers, which produces a low win rate and a large payoff ratio. A fixed take-profit closes winners at a set distance, which raises the win rate and shrinks the payoff. The Builder's fixed-exit trend templates use a 2:1 target-to-stop at stock settings, so before costs they break even at a 33.3% win rate. Read win rate together with the payoff ratio, never alone.
- Which timeframe suits a trend EA?
- H1 and H4 are the usual home, because a trend has to last long enough to pay for the entries that fail. Lower timeframes do not remove trends; they lower the ratio of move size to trading cost. The Builder's trend templates are measured on USD/JPY M5, where their stock-settings profit factors run from 0.65 to 1.07. A rule that is reasonable on H4 is a different proposition on M5.
- Does a trailing stop make a trend EA better?
- Not automatically, and it can make it worse. In the Builder's stock-settings baseline, the Multi-TF Trend template (fixed 50-pip stop, 100-pip target) scored a profit factor of 0.97. The Multi-TF + Auto Lot + Trailing template uses the same entry with a different exit package — a 25-pip trailing stop, a 40/120 stop and target, 1% risk sizing and no spread filter — and scored 0.65, with trade count up from 251 to 452. Several things changed at once, so the trail is not the proven cause, but a trail set inside the symbol's ordinary noise does remove the large winners the strategy exists to catch. Test the trail distance against the symbol's ATR, not against a round number.
- How long a losing streak should I expect from a trend EA?
- Long enough that you must decide in advance whether you will sit through it. At a 33% win rate, a run of nine or ten consecutive losses is an ordinary event over a few hundred trades rather than a sign that anything is broken. Read the worst losing run in your own backtest before funding the account; a strategy abandoned during an ordinary streak only ever takes the losses.
- Why does swap matter more for a trend EA than for a scalper?
- Because positions are held across nights and weekends. A scalper pays spread and commission many times; a trend EA pays them a few times a month and instead pays financing for every night the position stays open. On winners held for days, swap is a structural cost. Read SYMBOL_SWAP_LONG and SYMBOL_SWAP_SHORT for the actual symbol rather than assuming a small number.
Glossary