Mean Reversion
Mean-reversion EAs enter against a move once price has stretched a measured distance from its average, and target the return. The label names the entry only. In the Builder's recorded search, twelve stop-and-target settings on each of the RSI and Bollinger reversal templates never cleared a 1.0 profit factor, even in-sample.
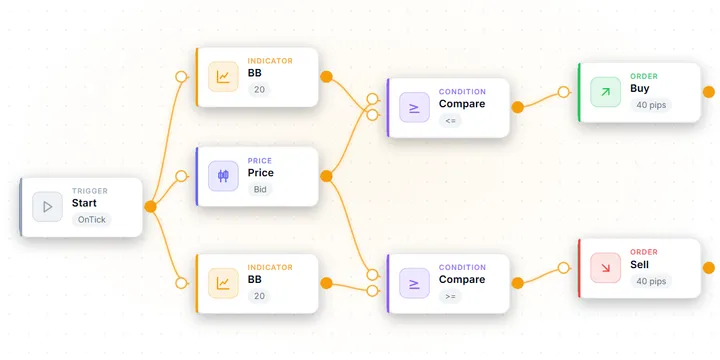
At a glance
The entry is a distance from the mean
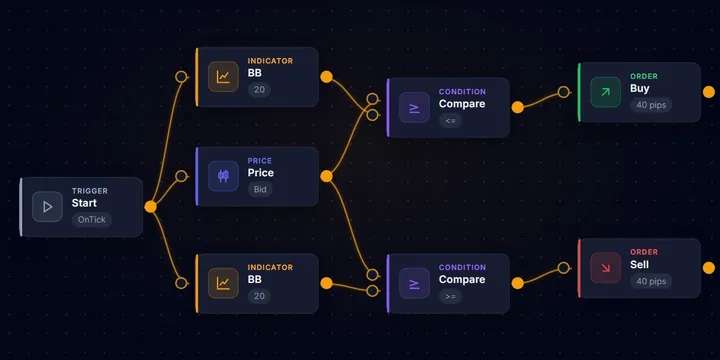
The EA waits for price to stretch about 1.5 to 2.5 standard deviations from its average, enters against the move and targets the mean itself. Here the entry is a touch of the 2σ band.
At a glance
Stock settings: profit factor by reversal template
The Builder's baseline on USD/JPY M5 over one year, default inputs, no optimisation. Only the pullback entry that fades dips in the direction of the trend clears a profit factor (PF) of 1.0.
Mechanism
The EA measures how far price has deviated from a moving average or Bollinger centre, usually in standard deviations or ATR units, and confirms the stretch with an oscillator in extreme territory. Entry is against the move; the target is the mean, and the stop sits beyond the level that would invalidate the reversion thesis. The distance between those two exits fixes the shape of the record. A target close to the entry produces a high win rate and a payoff ratio well below 1; a target at the full mean produces the reverse. Neither setting creates an edge the entry does not have.
Suitability
Best where the symbol spends most of its time inside a range and returns to a definable centre — historically the CHF crosses, EUR/GBP and AUD/CAD. Structurally unsuited to momentum currencies during trend phases, when the stretch keeps stretching and a counter-trend position is held against a move that does not return. A trend or regime filter is close to mandatory, and the direction of the higher-timeframe trend matters more than the oscillator level. Suitable for a trader who can accept long losing runs that arrive in a block, and who reads the stop distance before the win rate.
Notes
Mean reversion bets on elastic rather than momentum: that a price stretched far from its average is more likely to snap back than to keep stretching. The EA waits for a statistically significant deviation — typically 1.5 to 2.5 standard deviations from a moving average or Bollinger centre. It confirms the stretch with an oscillator in extreme territory, then enters against the move and targets the mean itself.
That describes the entry, and the entry is the part most people understand. The description usually bolted onto it — mean-reversion systems win most of their trades and lose big occasionally — is a claim about where the exits sit, not about the mechanism. This page covers how the machine is built inside MetaTrader 5 and what the Builder’s own measured reversal templates show. It ends with how to stress-test one before any capital is exposed.
How it works: the entry is a distance, the exit is the shape
The entry side is a measurement, and the three common constructions are close to interchangeable:
- Deviation from a moving average. Price a set number of ATR units or standard deviations from a mean. The whole strategy in one line.
- Bollinger touch or close beyond the band. The same idea with the deviation calculated for you. A close beyond the band is stricter than a touch, and it changes trade count more than win rate.
- Oscillator extreme with a regime filter. RSI or Stochastic past a threshold, gated by a reading that says the market is not trending. The filter is the difference between a mean-reversion EA and one that fades trends until it is stopped out of all of them.
The exit has two parts: a target at or near the mean, and a stop beyond the level that invalidates the thesis. Expectancy per trade is win rate × average win − (1 − win rate) × average loss, and once the two exit distances are fixed the terms stop being independent. Pull the target close and the win rate rises while the average win shrinks below the average loss. Push it out to the full mean and the reverse happens.
The classic reversion arrangement is a near target and a wide stop — a high win rate paid for with a payoff below 1. The ten reversal templates measured below ship the other way round, with a target twice the stop (30/60 or 40/80 pips). That breaks even at a 33.3% win rate before costs, and it means the stock baseline below measures the entry under a trend-shaped exit.
What the Builder’s reversal templates show at stock settings
The EA Builder prints a measured baseline on the template cards that have one, and ten of its reversal templates do. In our own stock-settings baseline of the Builder’s templates — a single USD/JPY M5 run over one year, default inputs, no optimisation — most finished below a 1.0 profit factor. The reversal family is no exception.
| Test conditions | |
|---|---|
| Source | Baseline printed on each template card in the EA Builder |
| Symbol / timeframe | USD/JPY M5 (Exness MT5); the Dual-Pair basket trades EUR/USD and GBP/USD |
| Period | 2025-06-01 – 2026-06-09 |
| Model | M1 OHLC (bar-level, not real ticks) |
| Deposit / inputs | 10,000, template defaults, no optimisation |
| Template | Entry | Stop / target (pips) | Profit factor | Trades |
|---|---|---|---|---|
| MA Pullback Buy | Price 0–20 pips above EMA 50 and RSI below 45, buys only | 40 / 80 | 1.10 | 159 |
| Envelope Reversal | Bid beyond a 0.1% envelope of SMA 20 | 30 / 60 | 0.98 | 986 |
| Bollinger Bounce | Touch of the 20-period, 2σ band | 40 / 80 | 0.97 | 632 |
| Stoch + BB | Stochastic below 20 at the lower band (mirrored for sells) | 30 / 60 | 0.96 | 896 |
| Pin Bar Reversal | Bullish pin bar and RSI below 35, buys only | 40 / 80 | 0.96 | 179 |
| RSI Reversal | RSI 14 below 30 / above 70 | 30 / 60 | 0.94 | 682 |
| Range Filter Reversal | RSI 30/70 only when the 10-bar range is 10–80 pips | 40 / 80 | 0.90 | 573 |
| MFI Reversal + StdDev | MFI 20/80 only while StdDev 10 is below StdDev 40 | 40 / 80 | 0.80 | 362 |
| 3-Strategy Portfolio (Mean-Reversion Mix) | RSI + Bollinger + Envelope in one EA | as each part | 0.92 | 2,287 |
| Dual-Pair RSI Basket | RSI 30/70 on EUR/USD and GBP/USD, up to four positions | 30 / 60 | 0.87 | 12,953 |
Four things follow, and the folklore predicts none of them.
The exit dial moves the shape, not the edge. The Builder records a stop-and-target search for RSI Reversal and Bollinger Bounce on USD/JPY H1. Each was run with twelve combinations — stops of 20 to 50 pips, targets of 20 to 100 — over three windows: 2018–2021, 2022–2024 and January 2025 – June 2026. The best in-sample profit factor of either template was 0.91. That grid includes near targets and far ones. When no placement wins even in the window it was chosen on, the entry has nothing for the exit to shape.
A filter is not automatically an improvement. Range Filter Reversal adds a 10-bar range gate to the RSI 30/70 entry and scores 0.90, against 0.94 for the plain version — though the stop and target differ too, so it is not a clean pair. MFI Reversal + StdDev, which only fades while volatility is contracting, is the weakest single-symbol template in the table at 0.80. A gate that removes trades removes good ones as well as bad ones.
The only template in the table above 1.0 fades in the trend’s direction. MA Pullback Buy buys dips only while price sits above a 50-period EMA, and scores 1.10 over 159 trades. It is a pullback entry — a reversion entry on a trend filter — and it never stands against the longer-term move. It still falls short of the Measure panel’s printed pass bar (profit factor at least 1.2, at least 60 trades, drawdown no worse than 20%).
Stacking reversal methods concentrates the risk. The three-method portfolio scores 0.92 — no better than its parts, because all three fade the same stretch. The Dual-Pair RSI Basket runs one RSI rule on two correlated pairs with up to four positions open. It produced 12,953 trades and a -36.38% drawdown, the deepest of any template in the Builder’s baseline. Correlated reversal positions are one bet placed several times.
Market conditions: when mean reversion pays and when it does not
| Condition | Favourable for a mean-reversion EA | Hostile for a mean-reversion EA |
|---|---|---|
| Market state | Range with a definable centre price returns to | A directional move that keeps extending |
| Volatility | Elevated but non-directional — wide bars, no net progress | Expanding with follow-through in one direction |
| The stretch itself | Caused by flow that exhausts — thin session, overreaction | Caused by information that repriced the pair |
| Higher-timeframe trend | Flat, or the fade is in its direction | Strong and against the fade |
| Holding cost | Short reversion, financing immaterial | A position held days against the move, paying swap to be wrong |
The bad environment is not a losing market — it is a directional one, the exact mirror of how trend-following fails in a range. The two lose money in different weather. It is also why losing runs cluster. Ten consecutive losses is not ten unrelated mistakes; it is one trending stretch met by the same rule ten times.
What caused the deviation matters as much as its size. A price stretched by thin liquidity is a candidate for reversion; a price stretched by a rate decision has been repriced, and there is no old mean to return to. No indicator separates the two, which is why a news filter matters more here.
The same elastic assumption drives statistical arbitrage, applied to the spread between two instruments instead of one price, and it breaks the same way. On a single pair such as EUR/GBP, the relationship assumed is the pair’s own history with its average.
Parameters and settings in MT5
In the Builder each of these is a block with its own inputs, and every value becomes an input in the compiled EA.
| Block and input | Typical starting point | What it controls |
|---|---|---|
Bollinger Bands / Envelope period, deviation | Long enough that the mean is a level, not a lagging copy of price | What the EA treats as the value price should return to |
| RSI / Stochastic / MFI thresholds | Confirmation only, not the trigger on its own | Filters stretches that are still accelerating |
Market Regime Filter Allowed regime = Range | ADX threshold around 25, tested rather than assumed | Suppresses entries in trends — the single most important input on this page |
MA Distance Filter Price side, Max pips (0=off) | Fade only on the side of a longer MA | Turns a counter-trend fade into a pullback entry |
Open Buy / Open Sell TP (pips) | At the mean, or a fraction of the distance to it | Together with the stop, sets win rate and payoff ratio |
Stop Loss SL Mode | Beyond the invalidation level, or an ATR multiple | The line between mean reversion and an accidental martingale |
Spread Filter Max Spread (points) | Just above the symbol’s normal spread | Extremes and wide spreads arrive together; this blocks the worst fills |
Position Filter Max Positions | 1 per symbol | Stops the rule from stacking the same fade |
Three MT5-specific realities decide whether a promising backtest survives contact:
- The stop has a minimum distance, and this strategy wants a wide one anyway. The broker rejects a stop closer than
SYMBOL_TRADE_STOPS_LEVEL. The EA the Builder generates checks that level, andSYMBOL_TRADE_FREEZE_LEVEL, before modifying a position, and keeps the current level rather than sending a rejected request. - Spread widens exactly where this strategy enters. The extremes it fades often occur in thin conditions. A test run on average spread overstates the edge of an EA whose entries cluster where spread is worst. Test with realistic or real-tick spread, and read the modelling quality before the profit.
- Holds are longer than the reputation implies. A reversion that takes days pays
SYMBOL_SWAP_LONGorSYMBOL_SWAP_SHORTevery night, and triple-swap day differs by broker.
- Fix the entry and the filter, then leave them alone — changing everything at once tells you nothing.
- Test the same entry with a near target and with a target at the full mean. Record win rate, payoff ratio and profit factor for each; if neither clears 1.0, stop tuning exits and change the entry.
- Set the stop from the level that invalidates the thesis, not from a round number.
- Run the regime or trend filter on and off over the same period. If it makes little difference, the test period contained no real trend and the result is untested rather than robust.
- Read the worst losing run in the resulting record and decide, before funding anything, whether you would sit through one twice as long.
Failure modes: how a mean-reversion EA loses money
- The stretch keeps stretching. The normal way this strategy loses. Every entry is against a move that does not return, and because the rule keeps re-qualifying, the losses arrive in a block.
- The mean moves. A repriced pair has a new average, and the EA keeps measuring distance from the old one.
- The stop is removed to avoid the loss. Widening a stop, or replacing it with an average-down, converts a defined-risk strategy into a grid with a good story. The equity curve improves immediately and the tail risk becomes unbounded.
- Correlated positions are counted as diversification. One reversal rule on two correlated pairs is the same bet twice. The Dual-Pair basket’s -36.38% drawdown is what that looks like at stock settings.
- Exits are tuned to rescue an entry. When no stop-and-target combination wins in-sample, searching harder only finds a fitted result.
- Cost is measured on the wrong bar. Entries cluster at extremes where spread is widest, and multi-day holds pay swap. Both are invisible in a test configured with fixed average spread and no financing.
How to build and stress-test a mean-reversion EA in AIStrategyMiner
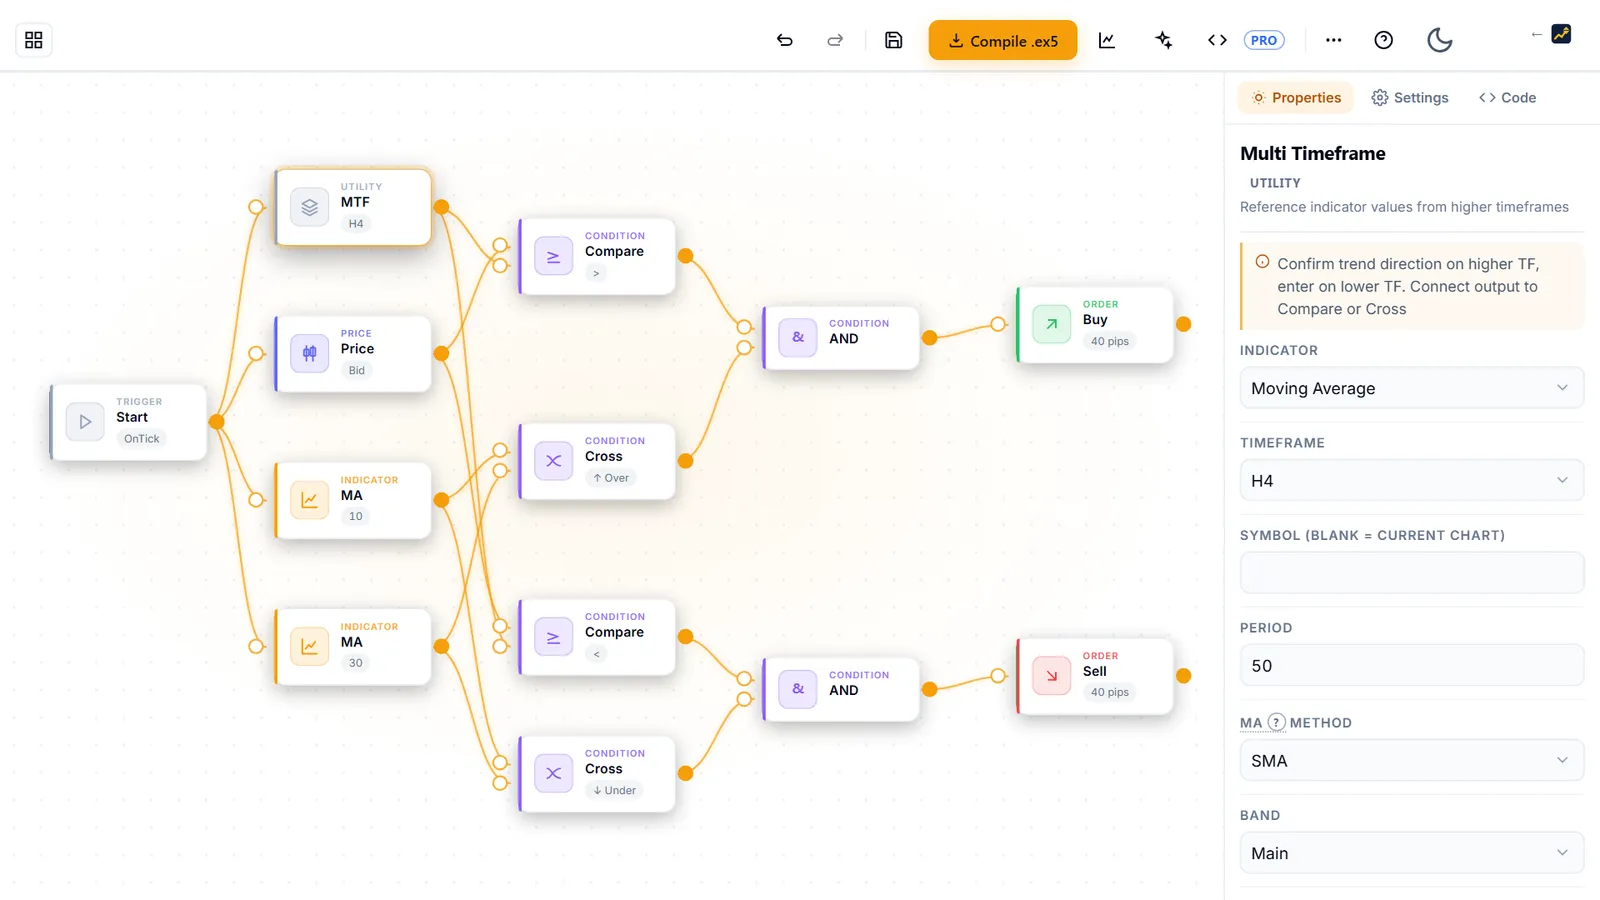
You do not need to write MQL5 to assemble the machine described above. A deviation measure, an oscillator confirmation, a regime gate, a target at the mean and a stop beyond the extreme are all blocks in the no-code Builder, and the reversal templates above arrive pre-wired. The fastest useful test is to load RSI Reversal and MA Pullback Buy side by side. The most visible difference between them is the trend filter, though the threshold, direction and exits differ too — so add an MA Distance Filter to RSI Reversal and change nothing else.
- Test one entry with a near target and with a target at the mean, and compare profit factor as well as win rate.
- Add a Market Regime Filter or an MA Distance Filter and measure the record with it off, so you know what the filter is actually doing.
- Press Measure for the approximate check against the printed bar, then run the compiled EA in the MT5 Strategy Tester on real ticks with realistic spread.
- Confirm the backtest period contained at least one sustained trend against the strategy.
The .ex5 compiled from your own flow is free. The .mq5 source is part of Pro, a one-off purchase with no subscription — see pricing if you want to edit the generated code. The site’s methodology sets out how backtest results should be read.
Mean reversion versus trend
| Mean reversion | Trend-following | |
|---|---|---|
| What it assumes | A stretched price returns to its average | An established direction continues |
| Entry relative to the move | Against it, at an extreme | With it, after confirmation |
| Loses when | The market trends and the stretch keeps stretching | The market ranges and moves fold back |
| Typical exit | Fixed target at or near the mean | Trailing stop or signal reversal |
| Worst case | A run of positions held against a move that does not return | A long series of ordinary losses |
| Complexity | Intermediate — the two exit distances carry the risk | Beginner — few inputs, hard to sit through |
Neither is safer in general: one needs stillness, the other needs movement. That is an argument for running both, with one caveat the table cannot show. A mean-reversion EA and a trend EA with a fixed take-profit both depend on price stopping where the rule says it should, and a reversal entry behind a trend filter is already half of each. Check what each exit does before assuming two EAs have diversified anything.
Build the same reversal twice, with and without a filter
Wire the entry once plain and once behind a trend or regime filter in AIStrategyMiner Builder, then backtest both on the same tick history. The one template above 1.0 in the Builder's baseline is the one with a trend filter.
- Compile a standard .ex5 file for MetaTrader 5 and read the worst losing run before you fund anything.
Check the finished EA in MetaTrader 5 before you trust it. The numbers on this page come from what you typed; they are not a forecast of results.
Related articles
Frequently asked questions
- What is a mean-reversion EA?
- A mean-reversion EA waits until price has moved a measured distance away from its own average, then enters against that move and targets the return. The distance is normally expressed in standard deviations from a Bollinger centre or in ATR units from a moving average, and an oscillator such as RSI or Stochastic in extreme territory is used as confirmation. The stop is placed beyond the level that would say the stretch is not a stretch at all but the start of a trend. It is the natural opposite of trend-following in its entry, and it fails in the opposite weather.
- Do mean-reversion EAs have a high win rate?
- Only when the target is placed close to the entry, and a high win rate bought that way is paid for in payoff. A target near the entry is reached often and pays little; a target at the full mean is reached less often and pays more. The reversal templates measured on this page ship with a target twice the stop, which breaks even at a 33.3% win rate before costs. The win rate follows from where the exits sit, not from the fact that the entry is counter-trend.
- Which pairs suit a mean-reversion EA?
- The textbook answer is the structurally range-bound crosses — EUR/CHF, USD/CHF, EUR/GBP, AUD/CAD — because a pair that keeps returning to a centre gives the strategy something to revert to. What matters in practice is narrower than the pair name: whether the specific symbol, on its timeframe, spends more time reverting than extending. The Builder's reversal templates are measured on USD/JPY M5, a trending pair on a noisy timeframe, and most of them score below 1.0 there. Test on the symbol you intend to trade rather than inheriting a pair list.
- How is mean reversion different from a grid or martingale EA?
- By the stop. All three hold exposure against an adverse move, and all three look profitable while the market obliges. A mean-reversion EA takes one position at a measured extreme and closes it at a defined loss if the reversion thesis is wrong. A grid or martingale EA answers an adverse move by adding to it, so the loss is only realised when the account cannot fund the next addition. If an EA sold as mean reversion has no stop, or averages down into a losing position, it is a different strategy wearing the label.
- Can a better target or stop fix a losing reversal entry?
- Not on the Builder's own records. RSI Reversal and Bollinger Bounce were each searched over twelve stop-and-target combinations — stops of 20 to 50 pips, targets of 20 to 100 — on USD/JPY H1 across three windows from 2018 to 2026. The best in-sample profit factor of either was 0.91. Moving the exits changes the win rate and the payoff ratio; it does not create an edge the entry lacks. Change the entry or the filter first.
- Does running several reversal methods together diversify the risk?
- Less than it appears. The Builder's 3-Strategy Portfolio runs RSI reversal, Bollinger bounce and envelope reversal in one EA, each on its own magic number. At stock settings it scored a profit factor of 0.92 over 2,287 trades — no better than its parts. Three entries that all fade the same stretch lose in the same trending weather, so their losses arrive together.
Glossary