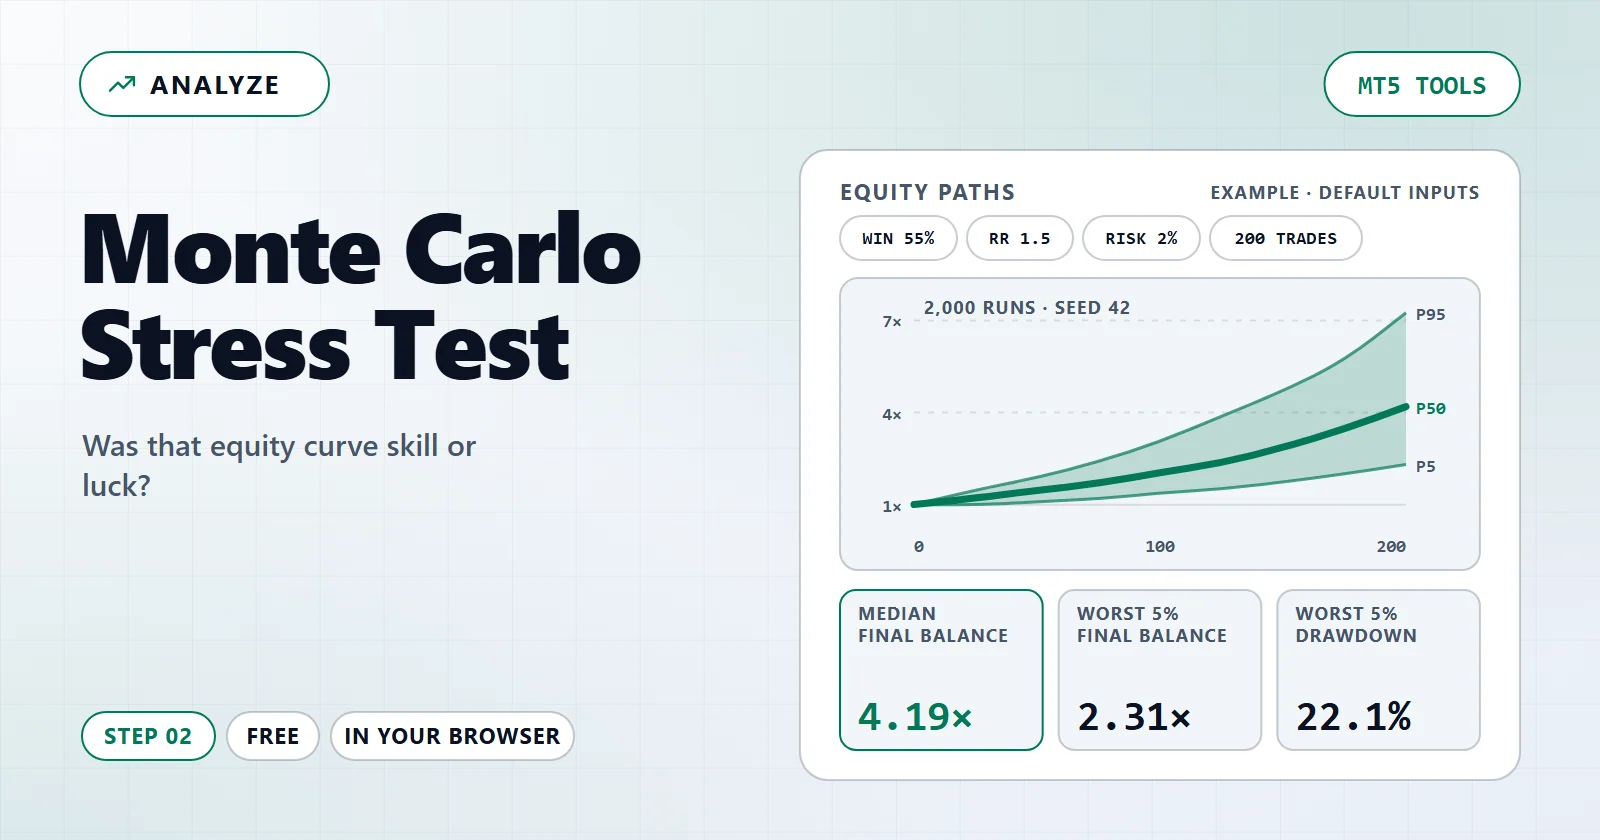
Was that equity curve skill, or one lucky ordering?
A backtest is one draw from a distribution. Shuffle the same win rate and reward-to-risk a few thousand times and you get the range of curves the strategy could have produced — including the ones that would have made you switch it off.
Free · No install · Runs in your browser
Diagnosis
A distribution does not tell you what to do. These checks compare it against a ruin limit, against how deep the tail goes, and against the one result you actually observed.
The range of outcomes
Read the outer columns as «this happened in one run out of twenty» and the middle as «this was the typical run». The gap between them is the part a single backtest cannot show you.
| Measure | Low 5% | Median | High 5% | Worst run |
|---|---|---|---|---|
| Final balance multiple of the starting balance | — | — | — | — |
| Maximum drawdown deepest peak-to-trough loss within a run | — | — | — | — |
| Worst losing streak consecutive losses within a run | — | — | — | — |
How the runs spread out over time
The middle column is the typical path. The outer two are the one-in-twenty cases on each side. They separate as the run goes on, which is why a short backtest can look like almost anything.
- Range of the middle 90% of runs (5th to 95th percentile)
- Median run
- Starting balance (1×)
| After trade | Low 5% | Median | High 5% |
|---|---|---|---|
| — | — | — | — |
| — | — | — | — |
| — | — | — | — |
| — | — | — | — |
| — | — | — | — |
| — | — | — | — |
| — | — | — | — |
| — | — | — | — |
How to use it
- Enter your numbersType your own values into the fields, or choose your MetaTrader report if the tool reads a file. The values already there are only a starting example.
- Read the result and the diagnosisThe large number answers the question. The cards under it say what looks wrong and what to change.
- Try a fix or take it furtherApply a suggested change to see the result move, follow the link to the next tool, or copy the link to come back to the same inputs.
How this is calculated
Each simulated trade either wins the reward/risk multiple or loses one unit of risk, drawn independently. That independence is the model's main simplification: real strategies cluster their losses, because the conditions that break them persist for weeks. Treat the tail here as optimistic, not conservative.
The point is not the median. Every strategy looks acceptable at the median. What decides whether you keep running it is the one-in-twenty path — the drawdown you did not plan for, arriving in the month you had just increased size.
Win rate and reward/risk are point estimates from a finite sample, and the simulation treats them as exact. Moving the win rate by two points shifts this whole distribution more than changing the seed does, which is worth trying before trusting any of it.
Questions and answers
Is it free, and do I need an account?
Free · No install · Runs in your browser. No account needed to calculate.
Is anything uploaded?
Nothing is uploaded. Every number on this page is computed in your browser, and the link you copy carries only the values you typed.
How far can I trust the result?
Nothing is uploaded and no trade history is read. The distribution comes only from the numbers you typed, so it inherits every error in them.
Related tools
Keep exploring
Turn this stress test into an EA of your own
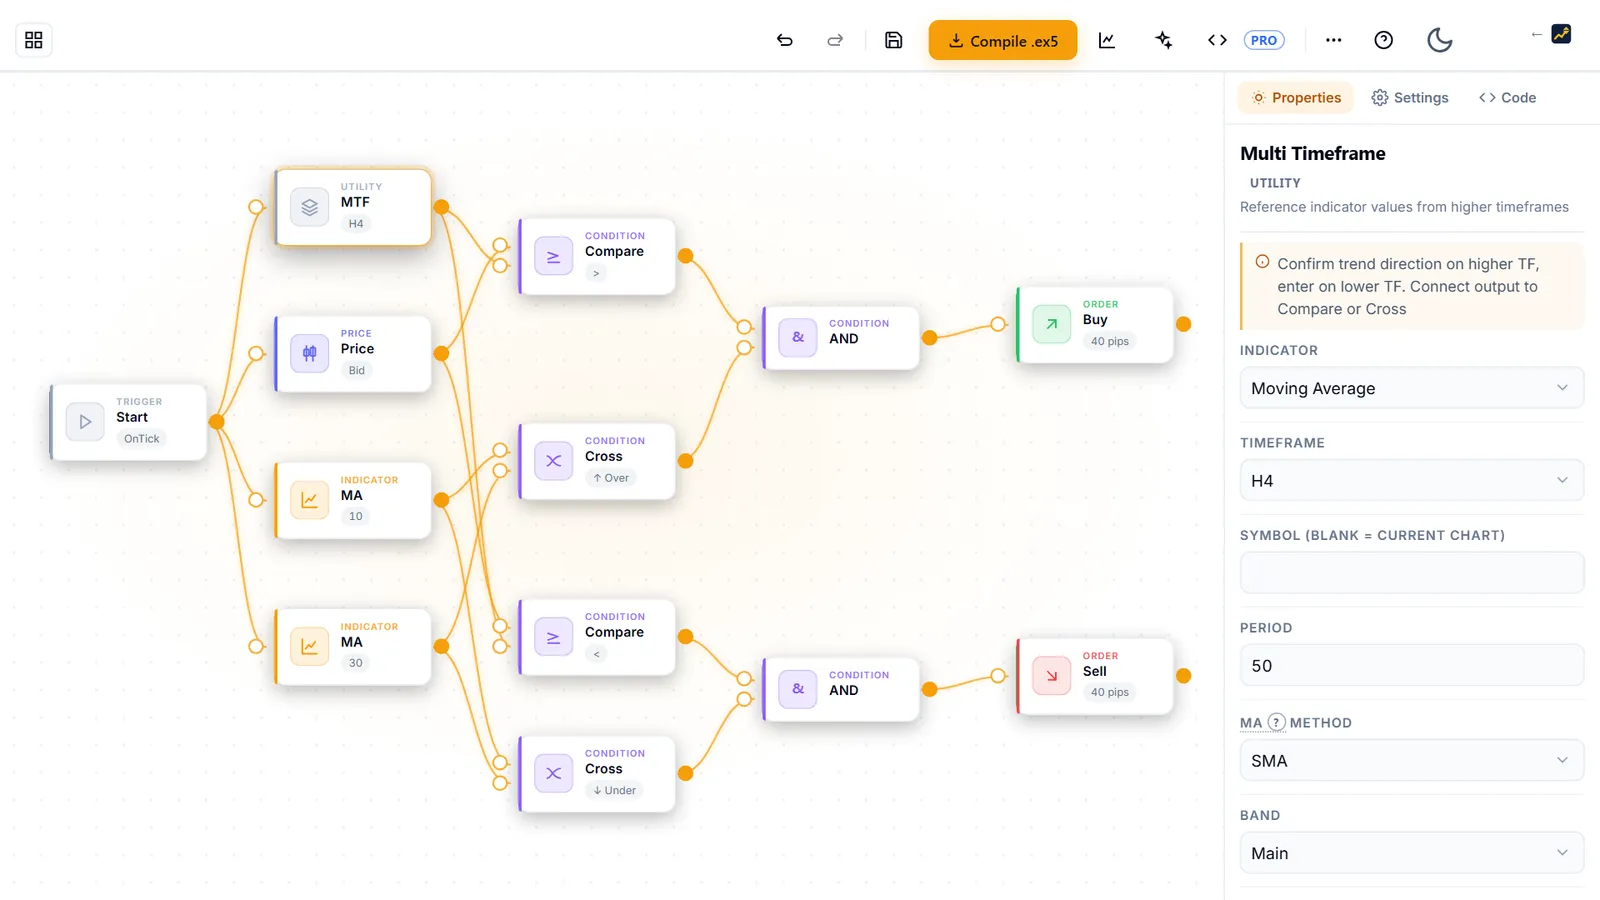
The settings you just stress-tested, such as risk per trade and number of trades, are the same settings an EA needs. AIStrategyMiner Builder lets you wire your entry and exit rules together as blocks and set the risk, with no code.
- Set the position size from the risk you tested here, then compile a standard .ex5 file for MetaTrader 5.
Check the finished EA in MetaTrader 5 before you trust it. This page is a stress test of the numbers you typed, not a forecast of results.