Does the edge survive the cells you did not optimise?
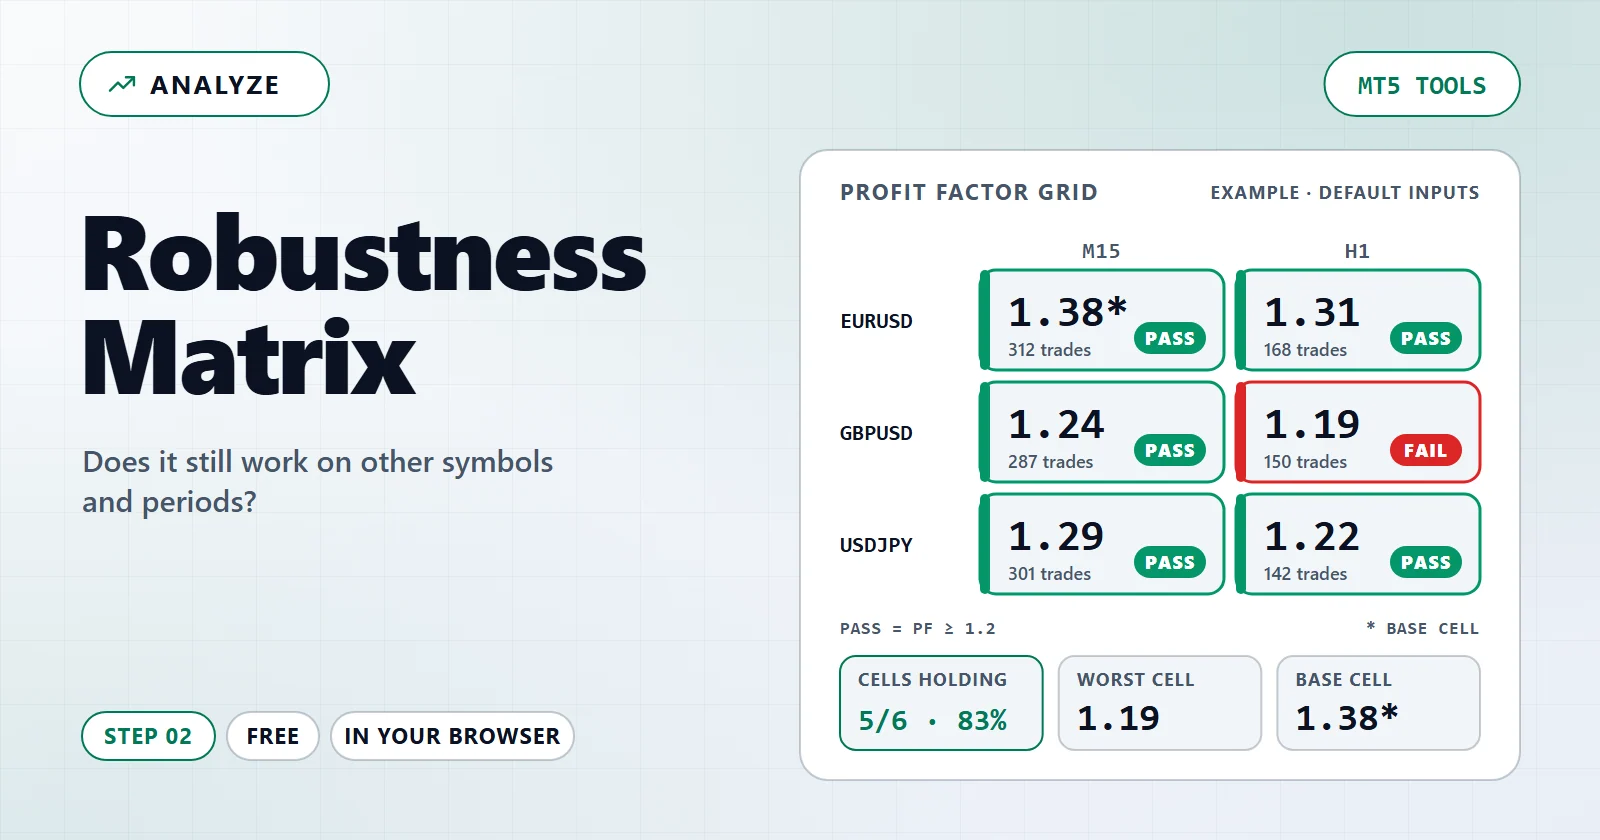
One backtest tells you that a setting worked once, somewhere. Run the same settings across a grid of symbols and periods and the shape of the answer decides the harder question: is this a plateau you can stand on, or one spike surrounded by cliffs?
Free · No install · Runs in your browser
Diagnosis
A grid full of numbers is not a verdict. These checks ask whether the passing cells are spread out or huddled in one line, whether the cell you optimised stands above the rest, and whether the cell next to it falls off a cliff.
Profit factor of each variant
- Variant at or above the line
- Variant below the line
- Pass line (profit factor)
The grid
Rows and columns keep the order you pasted them in, because that order is what makes two cells neighbours. A star marks the cell you optimised on.
By symbol and by period
The same cells added up the other two ways. This is where «it only works on one timeframe» becomes visible: one line carries every passing cell and the others carry none.
| Label | Cells | Passed | Median | Worst |
|---|
How to use it
- Enter your numbersType your own values into the fields, or choose your MetaTrader report if the tool reads a file. The values already there are only a starting example.
- Read the result and the diagnosisThe large number answers the question. The cards under it say what looks wrong and what to change.
- Try a fix or take it furtherApply a suggested change to see the result move, follow the link to the next tool, or copy the link to come back to the same inputs.
How this is calculated
Profit factor is the figure used here because it is the one that survives crossing symbols: gross profit divided by gross loss, with no account currency and no lot size inside it. Net profit cannot be compared across a grid — the same strategy earns different amounts on EURUSD and USDJPY for reasons that have nothing to do with whether it works.
What matters is the shape, not the average. A plateau — cells that all land near each other — means the settings are not leaning on the details of one period. A spike, with the optimised cell on top and its neighbours below the line, means the settings remember one stretch of history rather than describe a market.
This page grades the grid you paste; it cannot check that you ran it honestly. Cells from a single year, cells that overlap the period you optimised on, and cells with a handful of trades all look like evidence here. The grid is only as out-of-sample as the runs behind it.
Questions and answers
Is it free, and do I need an account?
Free · No install · Runs in your browser. No account needed to calculate.
Is anything uploaded?
Nothing is uploaded. Every number on this page is computed in your browser, and the link you copy carries only the values you typed.
How far can I trust the result?
Nothing is uploaded and no report is read. The grid comes only from the lines you pasted, so it inherits every error in them.
Related tools
Keep exploring
Terms behind this tool
- OverfittingTuning EA parameters too precisely to historical data, producing a strategy that backtests well but performs poorly on unseen data because it exploits noise rather than real market patterns.
- VolatilityVolatility is the degree of price variation over time — how far price moves, not which way. Statistically it is the standard deviation of returns; inside an MT5 EA it is read as Average True Range, and it decides whether last month's stop distance is still right today.
Build the next variant yourself
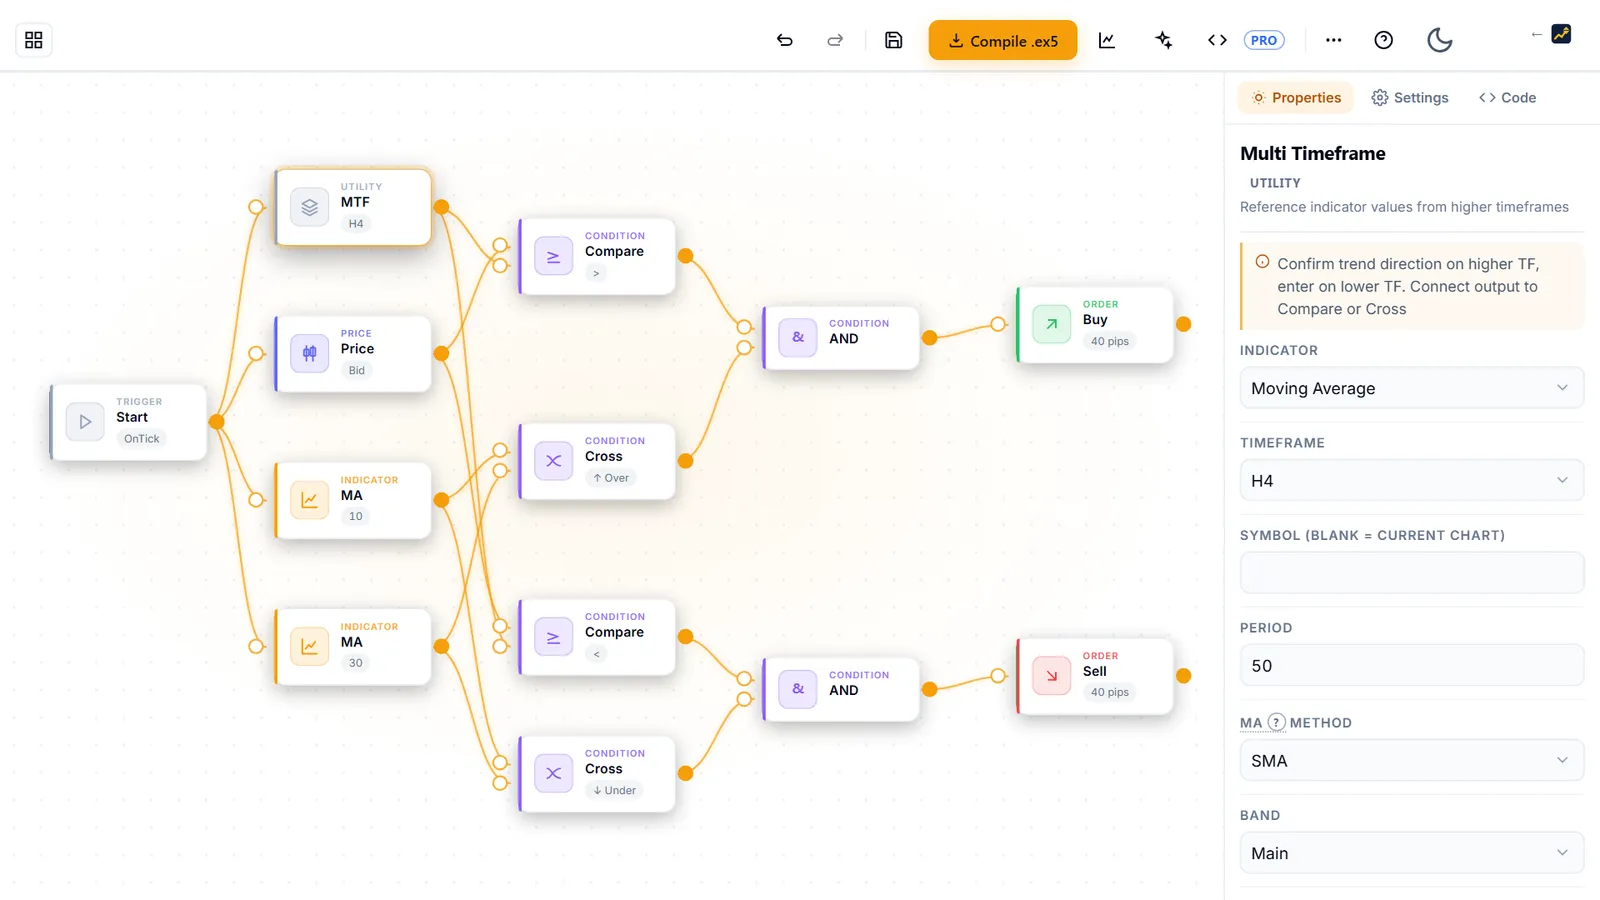
A robustness grid compares many versions of the same idea. AIStrategyMiner Builder lets you wire your entry and exit rules together as blocks, change one setting at a time and compile each version, with no code.
- Change one setting, compile a standard .ex5 file for MetaTrader 5, run it in the Strategy Tester and paste the result here.
Check the finished EA in MetaTrader 5 before you trust it. The numbers on this page come from what you typed; they are not a forecast of results.