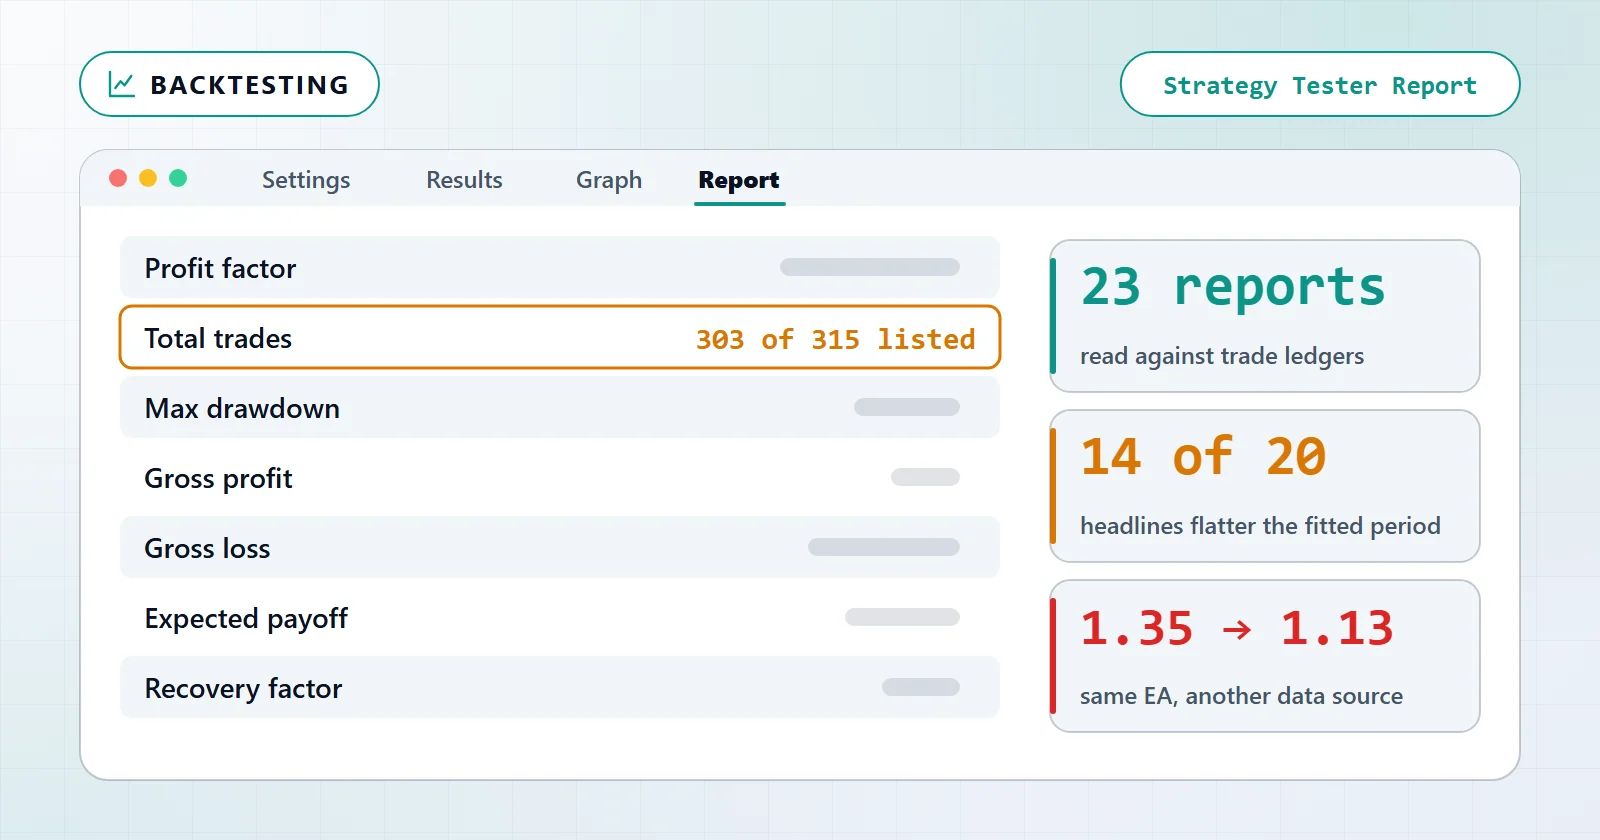
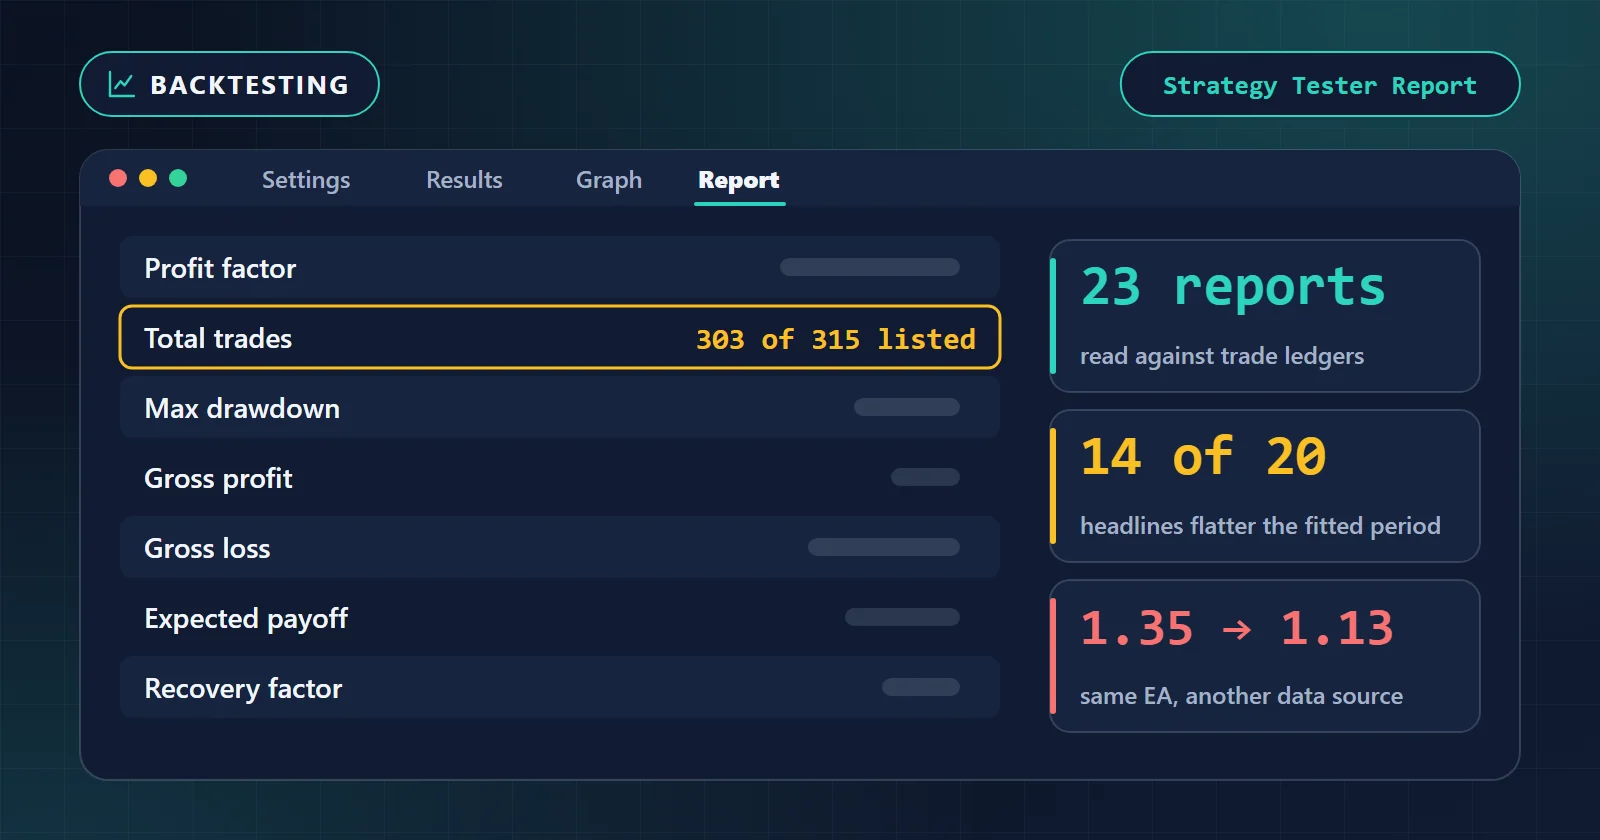
An MT5 backtest report is a claim about one specific set of trades produced on one specific price history. Almost every misreading comes from dropping half of that sentence. The headline profit factor gets read as a property of the expert advisor. It is a property of two other things: the population of trades the report covered, and the ticks the tester was fed.
This article is the reading order that produces a decision. What the report assumed before it printed anything, which metric answers which question, where each number lies to you, and what each reading tells you to change. The procedure for producing a report is a separate job — run a backtest covers that end to end.
| Test conditions | |
|---|---|
| Experiment ID | EXP-REPORT-READING-001 |
| Parent experiment | EXP-BACKTEST-RUNBOOK-001 |
| Source | data/run-manifests/*.json → results, ledger_recomputed, shadow_runs |
| Population | 23 finished MT5 Strategy Tester runs in our test archive |
| MT5 build | 6090 and 6140 |
| Model | Every tick generated from M1 bars (Model 0) and Every tick based on real ticks (Model 4) |
| Account | 10,000 USD deposit on all 23 runs |
| Records as of / last verified | 2026-08-26 |
Every figure below is a backtest, and all 23 runs carry a PASS verdict under the gate we apply to a finished run. That makes this a survivor set, so nothing here says how often a backtest passes. It says what a passing report looks like from the inside. How we run and label these tests is set out in our testing methodology.
Setup: what the report assumed before it printed a number
The Settings block at the top of an MT5 report is not preamble. It is the list of assumptions every number underneath inherits, and six of them decide whether the rest is worth reading. The broker name and build sit in the report’s own title line — ours read Exness-MT5Trial5 (Build 6090).
| Settings field | What it actually fixes | What ours record |
|---|---|---|
Symbol: / Period: | The regimes the result is a sample of | 22 runs start in January 2019; one starts in June 2021 |
| Model (tick generation) | How ticks inside each bar were produced | Model 0 (generated from M1 bars) on 12 runs, Model 4 (real ticks) on 11 |
Initial Deposit: | The denominator for every percentage on the page | 10,000 USD on all 23 |
| Spread | The cost taken out of every leg | Measured on exactly 1 of 23 — the rest inherit whatever the price history carried |
| Commission | A cost the tester applies only if you set it | 0 on all 23 |
Inputs: | The settings that produced this, in full | Verified against the report on every run |
The Inputs: list is the row people skip, and it is the one that makes a report reproducible at all: it is the complete set of values you would have to re-enter to get the same page back.
Two of those rows deserve a moment. A zero commission line does not mean commission was ignored. It means none was charged on the tested symbol. Those are different statements, and only the run record tells you which applies. And an unmeasured spread is not a zero spread: in 22 of our 23 runs that field is empty because no recorder ran alongside the test. Every leg simply took whatever spread the M1 history carried. Only the GBP/JPY M15 run can state its own mean, at 19.14 points.
One naming trap belongs here. The field older guides call modelling quality is printed by MT5 as History Quality:, in the Results block next to Bars:, Ticks: and Symbols:. Searching a Build 6090 report for “modelling quality” finds nothing. In our own records the figure is present on only 2 of the 23 manifests, because it is kept when the source report stated one — that is a property of these records, not a measurement of how often MetaTrader prints it. Practically it means you cannot use it as a filter for reports you did not generate. The tick data source is the question underneath it, and that one is always answerable: ask which history the run used.
Reading the report, metric by metric
Read the page in this order. It is deliberately not the order MetaTrader prints it in, because the two cheapest disqualifiers sit at the bottom of the report.
- Read
Settingsfirst. Model,Initial Deposit:, spread and commission. Every percentage below inherits them, and a run with an unmeasured spread is not a run with no spread. - Read
Total Trades:before any ratio. A ratio and its sample size are one fact, not two. Write the count down next to the ratio. - Ask which trades the headline covers. If a trade ledger is published alongside, check that its total matches
Total Trades:. One of our own 23 reports does not. - Read
Equity Drawdown Maximal:, not the balance line, and note whether you took theMaximalor theRelativefigure — they are separate rows. - Find the price history. Which broker, which source, which period. This is the field that moved a verdict in our records; the tick model was not.
Here is the whole reading in one table, using the labels the report actually prints. The “in our set” column is what each metric did across our 23 runs. That beats a textbook range, because it was measured on the same kind of report you are holding.
| Report label | The question it answers | In our set | Red flag |
|---|---|---|---|
Total Trades: | How much evidence there is | 108 to 4,725 per run | Under ~100; a ratio on 20 trades is a rumour |
Profit Factor: | Gross profit divided by gross loss (profit factor) | 1.22 to 1.59 across all 23 | Above ~2.0 on a short window; check Total Trades: first |
Profit Trades (% of total): | The win rate — the shape of the distribution, not its sign | 30.80% to 82.27%, all profitable | Quoted on its own, with no profit factor beside it |
Total Net Profit: | Currency won, before context | 386.05 to 28,687.43 USD on the same 10,000 USD deposit | Quoted without Initial Deposit: and the number of years |
Balance Drawdown Maximal: | Worst dip on closed trades (max drawdown) | 0.67% to 18.24% | Quoted while an equity line sits on the same page |
Equity Drawdown Maximal: | Worst dip including open positions | Deeper than balance in 23 of 23 | Ignored — it is the figure your margin lives on |
Expected Payoff: | Average result per trade, in currency | Not carried in our manifests | Read as a forecast rather than an average |
Recovery Factor: / Sharpe Ratio: | Return per unit of pain, two ways | Not carried in our manifests | Compared across reports with different trade counts |
History Quality: | Whether the tick stream can resolve your stop | Stated on 2 of 23 | Absent and the data source is unknown |
Two conventions in that block catch people out before any interpretation starts.
Total Trades: and Total Deals: are different counts. In MetaTrader 5 a round turn is two deals — one in, one out — so a report showing Total Trades: 50 shows Total Deals: 100 beside it, and partial closes add deals without adding trades. Read the ratios against trades, never against deals.
There are six drawdown lines, not one. The report prints Absolute, Maximal and Relative for both balance and equity. Worse, the money and the percentage swap places between two of them: Balance Drawdown Maximal: 36.84 (0.37%) puts the currency first, and Balance Drawdown Relative: 0.37% (36.84) puts the percentage first. Two reports can quote “0.37%” and “36.84” from adjacent lines and mean the same event — or different ones.
The rest of the Results block — Z-Score:, AHPR:, GHPR:, LR Correlation:, LR Standard Error:, Margin Level: and the MFE/MAE correlations — describes the shape of the equity curve rather than its size. None of it rescues a report whose trade count is too small, and none of it survives a change of price history any better than the profit factor does. Read it after the five steps above, or not at all.
Two of the metric rows do most of the damage in practice, so read them together rather than in sequence.
Net profit needs its denominator and its calendar. All 23 of our runs start from the same 10,000 USD, which makes them unusually comparable. They still span 0.51% to 57.38% per year. The low end is instructive. The JP225 H1 run reads a profit factor of 1.46 with a maximum drawdown of 0.67% — the best-looking pair of numbers in the set. It earned 386.05 USD over 7.58 years. Nothing about that report is dishonest. It is answering a different question from the one most readers think they are asking.
Win rate and profit factor are close to independent here. Across the 23 runs the correlation between them is 0.37. Most of what decides whether an EA makes money is therefore invisible to the win-rate line. The EUR/JPY M5 run wins 30.80% of its trades and returns a profit factor of 1.22; an AUD/CAD H4 run wins 82.27% and returns 1.59. Both are profitable, and the win rates are 51 points apart.
The profit factor your report is not showing you
This is the part no report shows you, and it is why we could write this article from our own data. Every run in our archive keeps its complete closed-trade ledger, so each report splits in two. There is the slice the settings were chosen on — the development window, up to a fixed cutoff date after which the settings were not changed. Then there are the trades that happened after that date, which nothing was chosen on. Twenty of our 23 runs contain both slices; the other three have no later slice at all.
| Run | Development slice | Later slice | Headline |
|---|---|---|---|
| JP225 H1 | 1.28 (195 trades) | 6.43 (15 trades) | 1.46 (210 trades) |
| AUD/CAD H1 | 1.31 (101 trades) | 3.58 (7 trades) | 1.38 (108 trades) |
| EUR/USD H1, 4 symbols | 1.48 (4,583 trades) | 1.64 (142 trades) | 1.48 (4,725 trades) |
| AUD/CAD H4 | 1.55 (136 trades) | — (5 trades, zero losers) | 1.59 (141 trades) |
| USD/JPY H1 (Exness M1 history) | 1.28 (624 trades) | 0.88 (21 trades) | 1.27 (645 trades) |
| US30 H4 | 1.53 (232 trades) | 0.72 (21 trades) | 1.43 (253 trades) |
Read the first and last columns of the JP225 row together. The headline says 1.46; the period the settings were actually chosen on says 1.28; the difference is 15 trades — 7% of the record — running at a profit factor of 6.43. Read the US30 row the same way and it runs the other direction: 1.53 on the development slice, 0.72 on the 21 trades since, and a headline of 1.43 that hides both.
Across the 20 runs that contain both slices, the headline reads better than the development slice in 14 and worse in 6. The other three are left out on purpose: with only one slice, their headline and their development figure cover exactly the same trades, so the difference between them is not a population effect at all — it is the report’s own two-decimal rounding against the recomputed ledger. A USD/JPY M1 run prints 1.52 where the ledger recomputes 1.5153. Apply that same rounding floor to the 20 and 13 of them still show a gap the rounding cannot explain, 8 of those in the flattering direction.
That asymmetry is not a scandal. A headline spanning two periods gets dragged toward whichever one was luckier. It does mean the headline is never the number to compare against a claim about future behaviour.
Pitfalls: how these numbers mislead
The failure mode underneath all five is the same: a report is a measurement of a population, and every metric on the page silently inherits whichever population the tester was pointed at.
Improve: what each reading tells you to change
One change per iteration, and re-read the same three figures each time: the trade count, the profit factor and the equity drawdown. The order below is by cost — the cheap checks first, because two of them regularly end the investigation.
- If the trade count is small, extend the period — do not touch the parameters. A profit factor built on fewer than about 100 trades moves more from a longer window than from any setting you could adjust. Our smallest run has 108 trades, and it is the one whose ratios we quote most carefully.
- If the headline and the development slice disagree, re-read on the development slice only. That is the figure the settings were chosen against. It is the one to compare against any other candidate.
- If equity drawdown sits well above balance drawdown, size on the equity figure. The gap tells you how many positions the EA holds into the same move. The GBP/JPY H1 run states it outright: up to seven at once.
- If the report came from someone else’s data, re-run it on a second source before anything else. This check has the largest measured effect in our whole set, and it is the last one people run.
What actually moved the numbers: data source, not tick model
One of these runs was repeated deliberately to separate those two variables, and the run record labels each shadow with what it isolates.
| GBP/JPY M15 run | What changed | Trades | Profit factor | Max drawdown | History quality | Verdict |
|---|---|---|---|---|---|---|
| Original | Exness M1 history, Model 0 | 303 | 1.35 | 9.92% | 99% | PASS |
| Shadow — isolates data source | Dukascopy history, Model 0 | 351 | 1.13 | 18.18% | 99% | FAIL |
| Shadow — isolates real ticks | Dukascopy history, Model 4 | 345 | 1.11 | 18.20% | 100% | FAIL |
Read it as two separate experiments. Changing only the price history — row one to row two, same tick model — took the profit factor from 1.35 to 1.13, nearly doubled the drawdown, and flipped the verdict from pass to fail. Changing only the tick model on that new history — row two to row three — moved the profit factor by 0.02 and the drawdown by 0.02 points. And the history quality reads 99% and 100% on the two runs that failed, so the field most people screen on was excellent throughout.
A second EA points the same way from a different angle. A USD/JPY M15 run on Dukascopy real ticks reads a profit factor of 1.33 with a 7.11% drawdown, and its shadow run on Exness M1 history at Model 0 reads 1.30 and 6.76% — both source and model changed at once, and the result barely moved. Stability across data sources is possible. It just is not something a single report can demonstrate.
The practical rule: a report is portable evidence only to the extent its price history is. Re-running on a second source costs one evening. In our records it is the only check in this article that has changed a decision.
Next steps: from a report to a decision
Reading a report well is the second of four steps. The sequence is backtest → read → walk-forward analysis → demo, and each one removes a different way of being wrong. A report that survives all four has earned a small position; one that survives the first two has earned another test.
- If a number sends you back to the strategy rather than the test, the Builder is where the rule itself changes. A search over settings is a different job again, covered in parameter optimisation.
- Before you size anything on a drawdown figure you have just read, risk management for EA traders turns it into a deposit and a lot size.
Past results in a tester are not a forecast, and none of the runs above is a promise about the next 12 months. The point of reading a report properly is smaller and more useful than a prediction. It tells you what has been demonstrated, and what has merely been printed.