US500 is not a currency pair. It is a CFD on the S&P 500, the world’s benchmark equity index and the default gauge of global risk appetite. It carries a long-run upward drift, which gives a trend EA a tailwind no forex pair offers. But it is also a leveraged claim on a cash session that closes and reopens, so it fails in ways a 24-hour FX system never learned to fear. Set against its higher-beta sibling NAS100, the S&P is the calmer, broader-feeling index. The first thing to decide is whether your strategy wants the drift-plus-gap character of an equity index or merely tolerates it. Sizing and stop logic ported from forex will mis-risk the account before the entry signal has done anything at all.
This page covers what the S&P gives an automated strategy that a forex pair does not, the sessions that decide its results, and what it costs in index points. It then covers the failure modes that catch FX-built systems, and how to build and test a US500 EA of your own.
How US500 Behaves: What The S&P Gives an EA
The S&P 500 is a capitalisation-weighted index of large US companies, traded here as a CFD. It is structurally different from a forex major in ways that matter more for automation than any indicator choice. Its catalysts — the Fed, the earnings calendar — and its arithmetic both sit outside the FX world an EA was probably designed for.
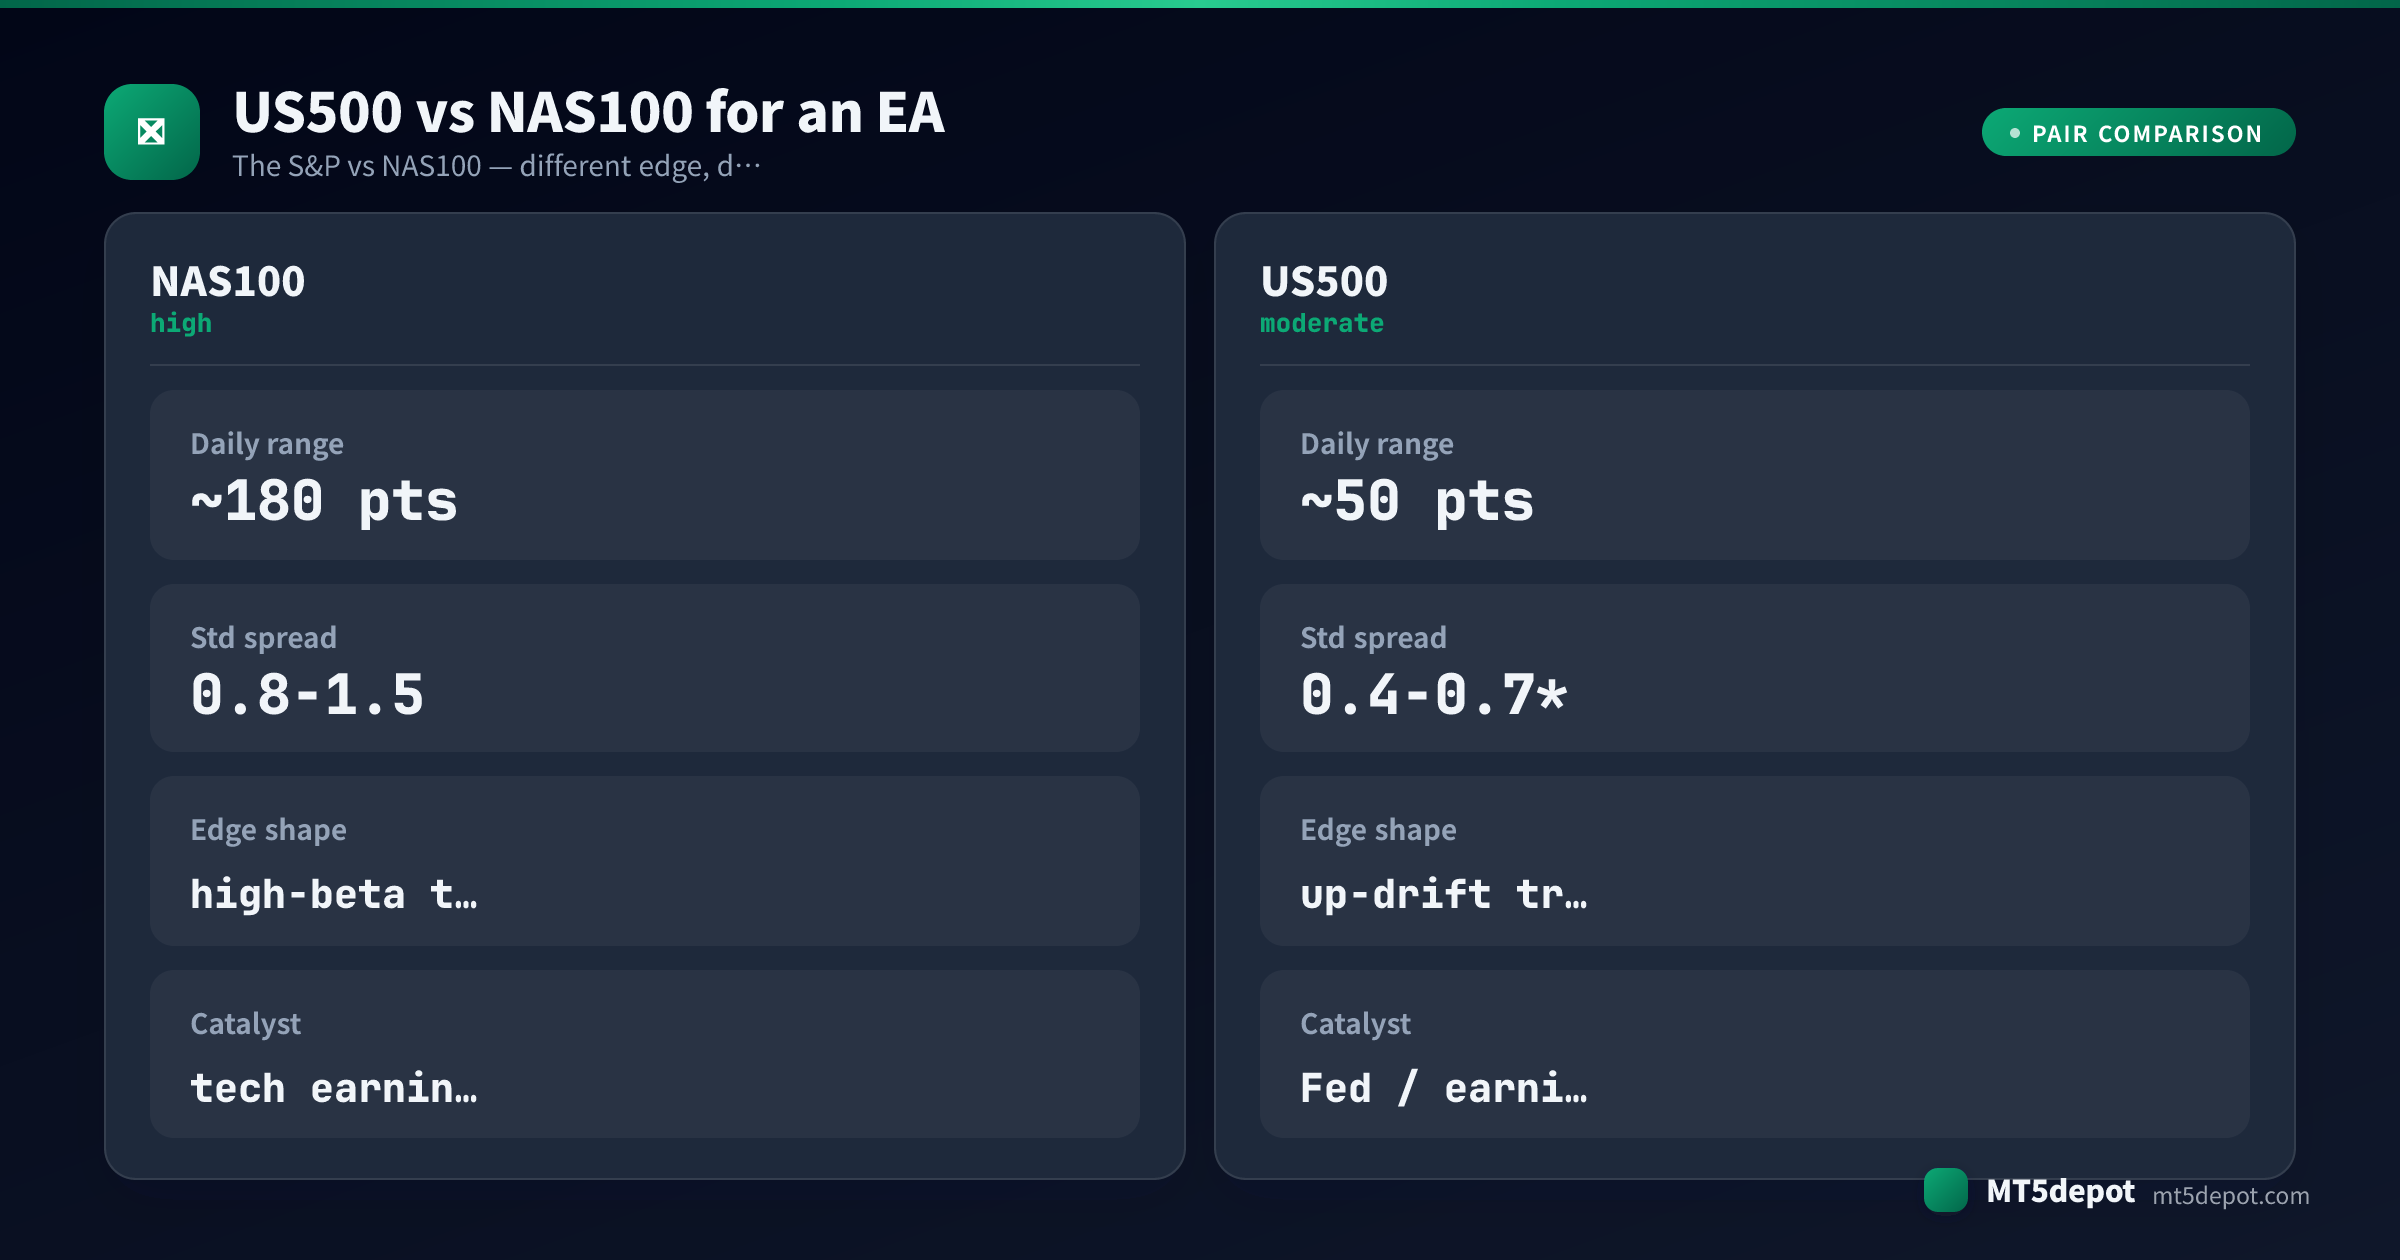
For an EA, that character reduces to three properties:
- A long-run upward drift. Equities have historically trended up, which gives a trend-following EA on the S&P a structural tailwind a forex pair does not have. The index spends more of its life making higher highs than a mean-reverting currency does. That drift is the fact this page is easiest to build around.
- An overnight cash-session gap. Unlike a 24-hour forex pair, the S&P CFD tracks a cash session that closes and reopens around a daily maintenance break. The price can gap across that break, and a stop sitting inside the gap is not filled at your level — it is jumped. This is contract mechanics, not a live measurement — and the property most forex-built EAs have never had to model.
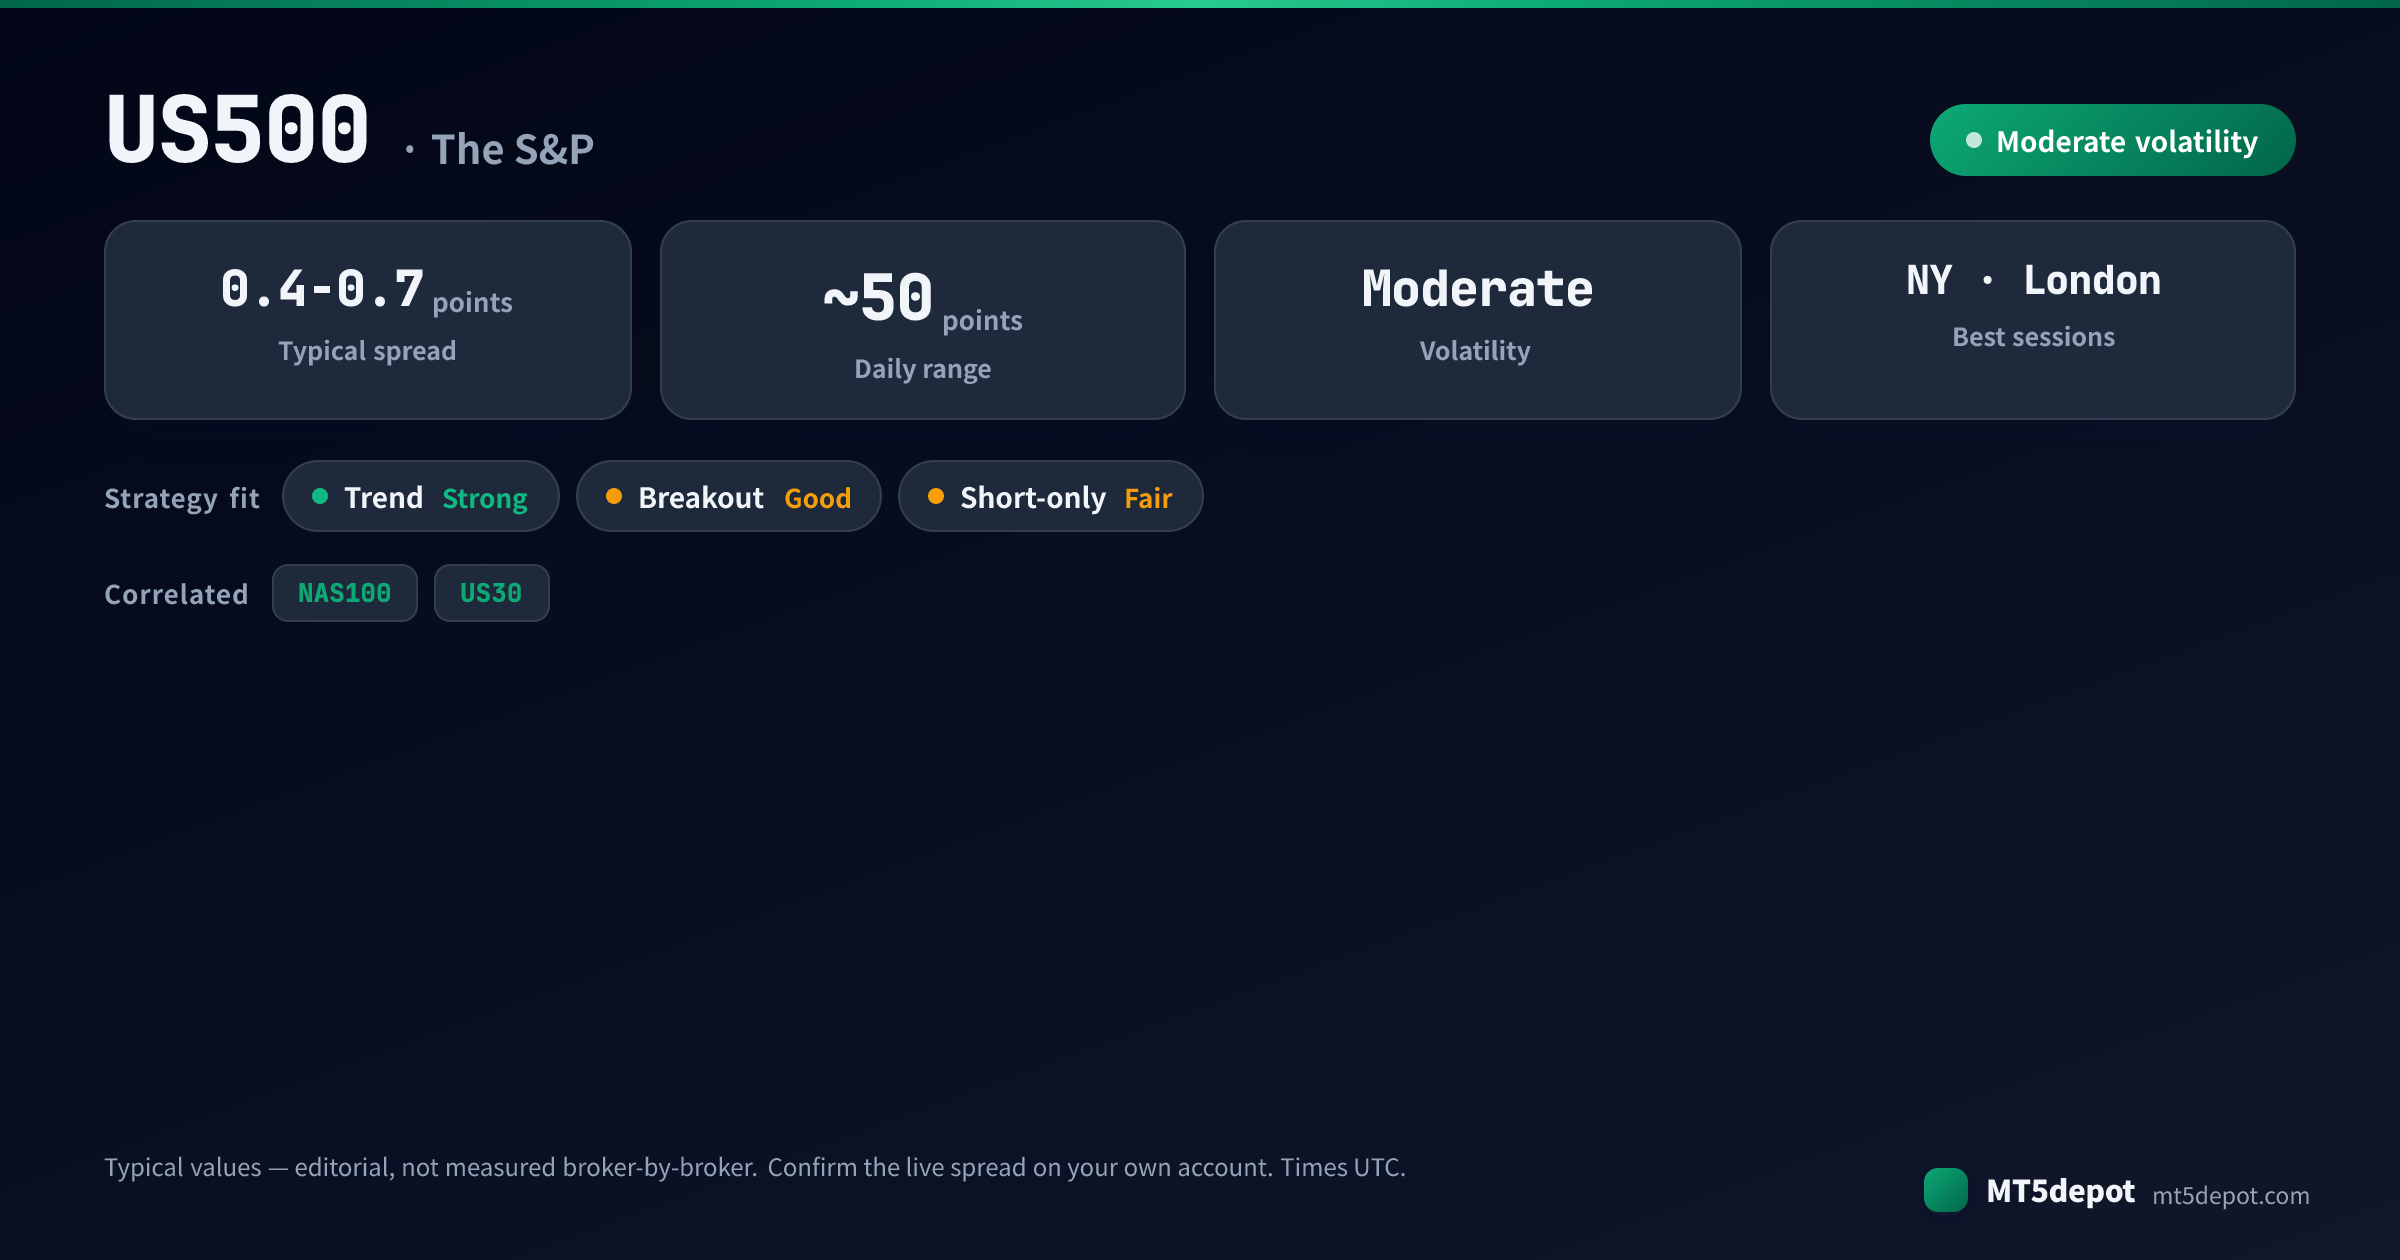
- Point value, not pip value. Index P&L accrues per point at a contract multiplier, so the money at risk per point bears no relation to a forex pip. Our published typical daily range is around 50 index points — labelled typical, not measured broker-by-broker. What that range costs or earns depends entirely on the multiplier your account applies, and that is where a forex-shaped sizing model goes wrong.
The trap for automated strategies is that the S&P’s clean upward drift looks like an easy trend edge on a backtest. The same instrument gaps its price overnight, charges financing on anything held past the rollover, and concentrates its weight in a handful of mega-caps — three costs a forex-tuned EA never priced in. The S&P rewards strategies that respect its equity-index volatility mechanics, and quietly drains ones that treat it as EUR/USD with a bigger number on the chart.
Which EA Strategies Suit US500?
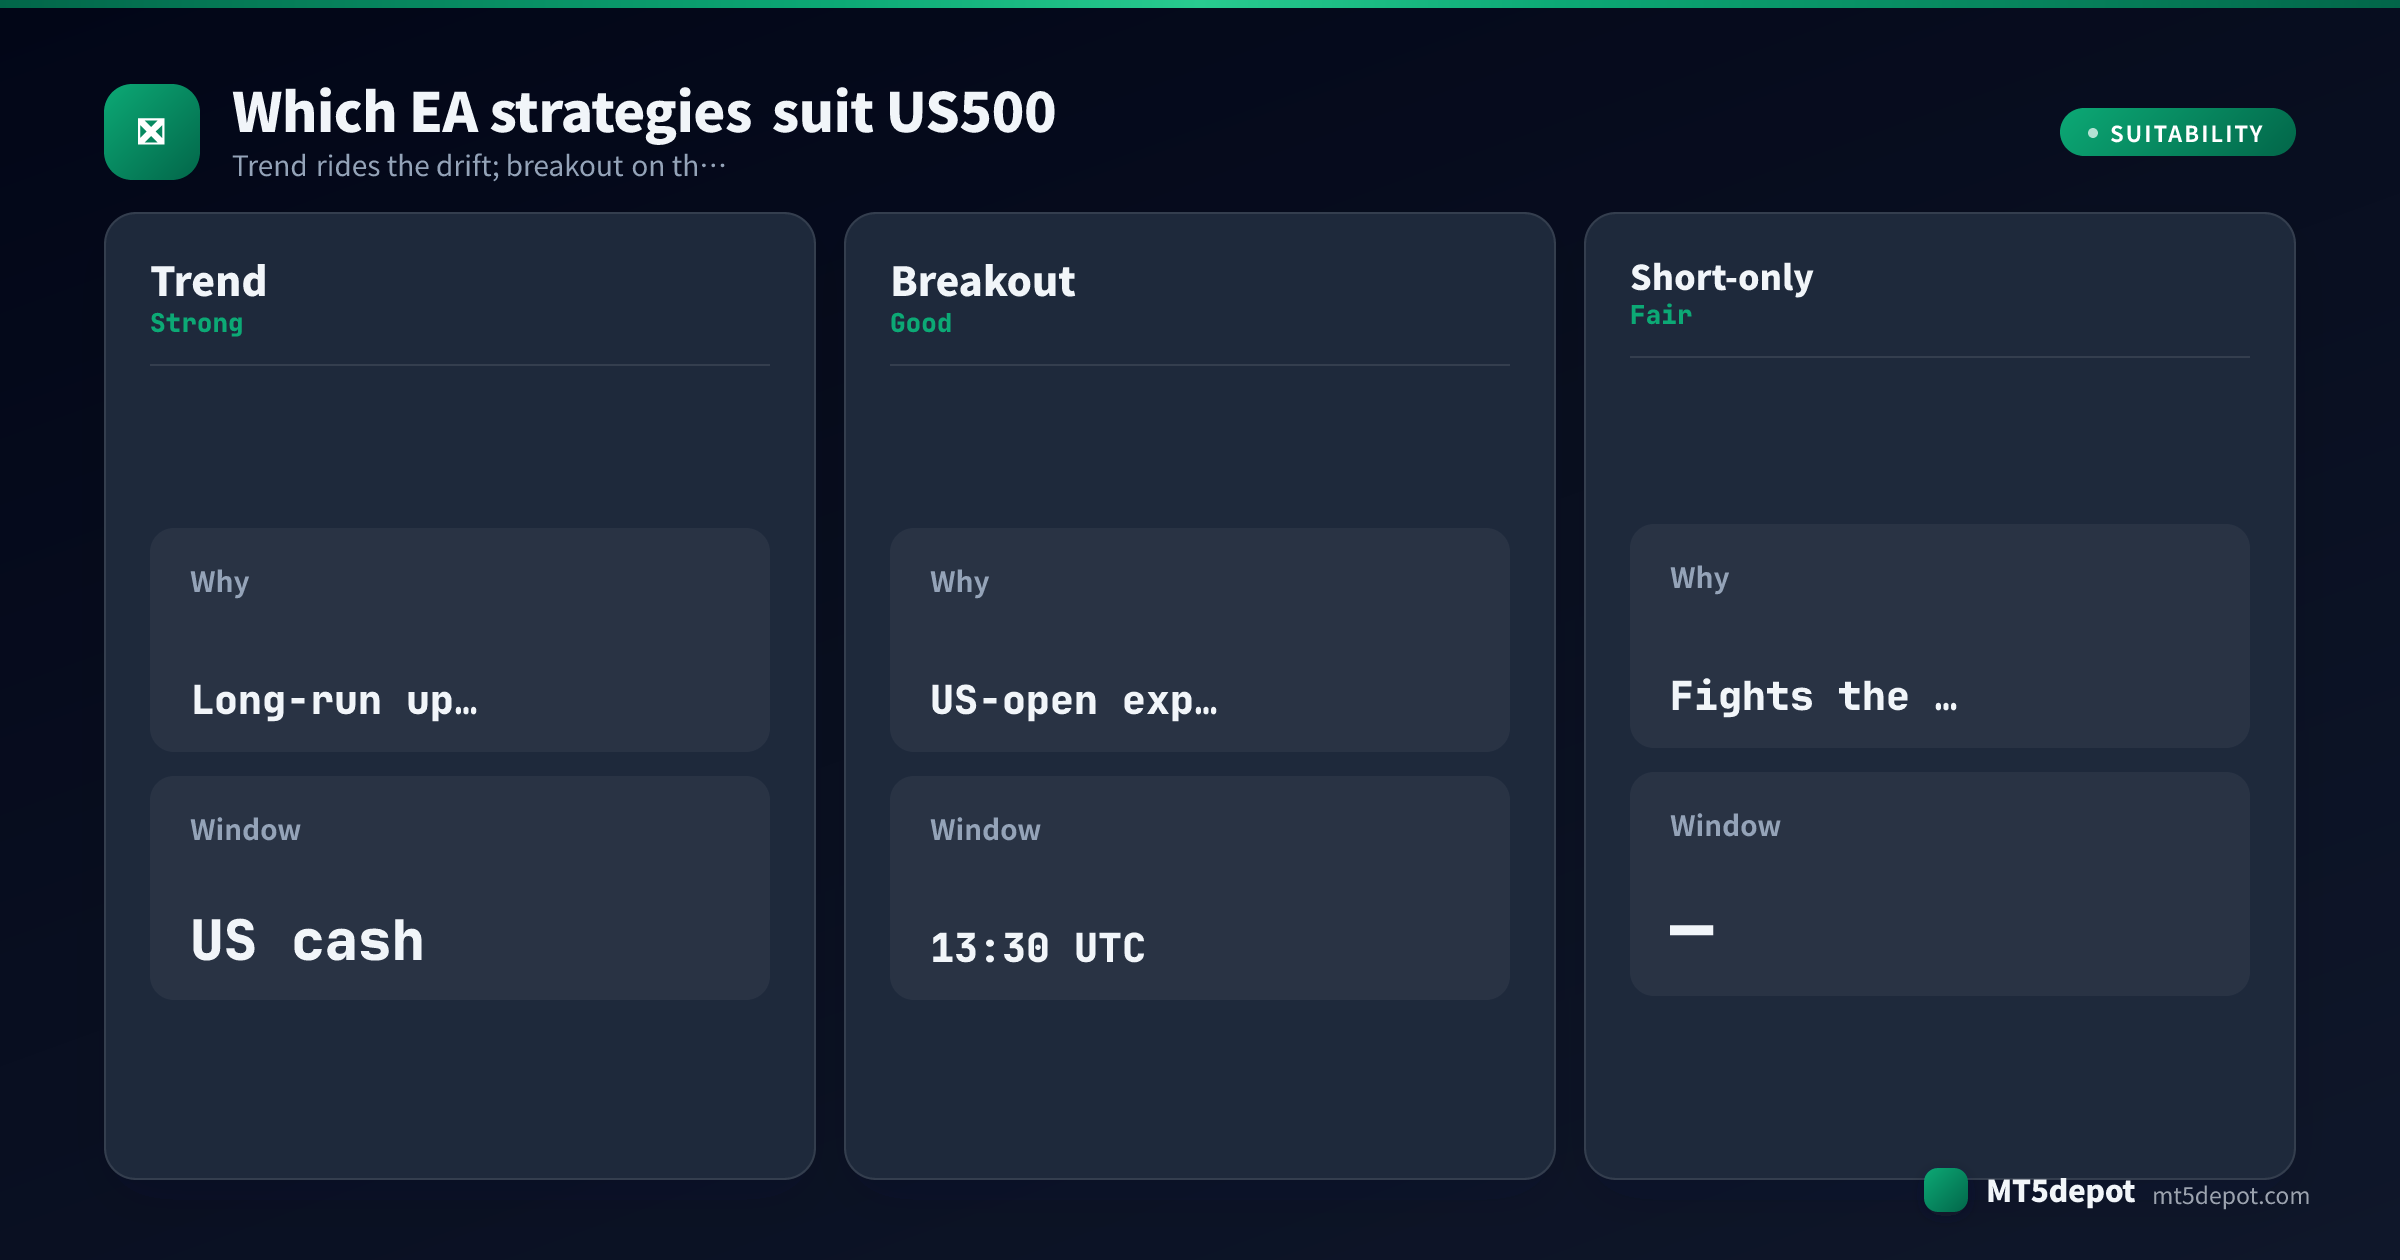
The instrument’s profile lists trend and breakout as suitable — but suitability is an editorial assessment, not proof. In our own stock-settings baseline of the Builder’s templates — a single USD/JPY M5 run over one year, default inputs, no optimisation — most finished below a 1.0 profit factor, and that run was not on US500. Almost none cleared the Builder’s own bar at stock settings, so treat any edge on US500 as something your own settings and test have to earn. Look for it in mechanics — session windows, gap-aware stops, sizing discipline — not the indicator on the box. What the S&P’s character tends to support:
| Strategy | Fit on US500 | Why |
|---|---|---|
| Trend | Strong | The long-run up-drift gives a momentum system a structural tailwind — riding the drift through the US cash session is the shape the index most naturally rewards. |
| Breakout | Good | The US cash open (around 13:30 UTC) produces a repeatable expansion off the overnight range; pending-order entries at the level reduce the spread cost a market fill pays. |
| Short-only | Fair | It can work in a real risk-off leg, but a short bias fights the index’s upward drift, so a system that is only short is trading against the tide most of the time. |
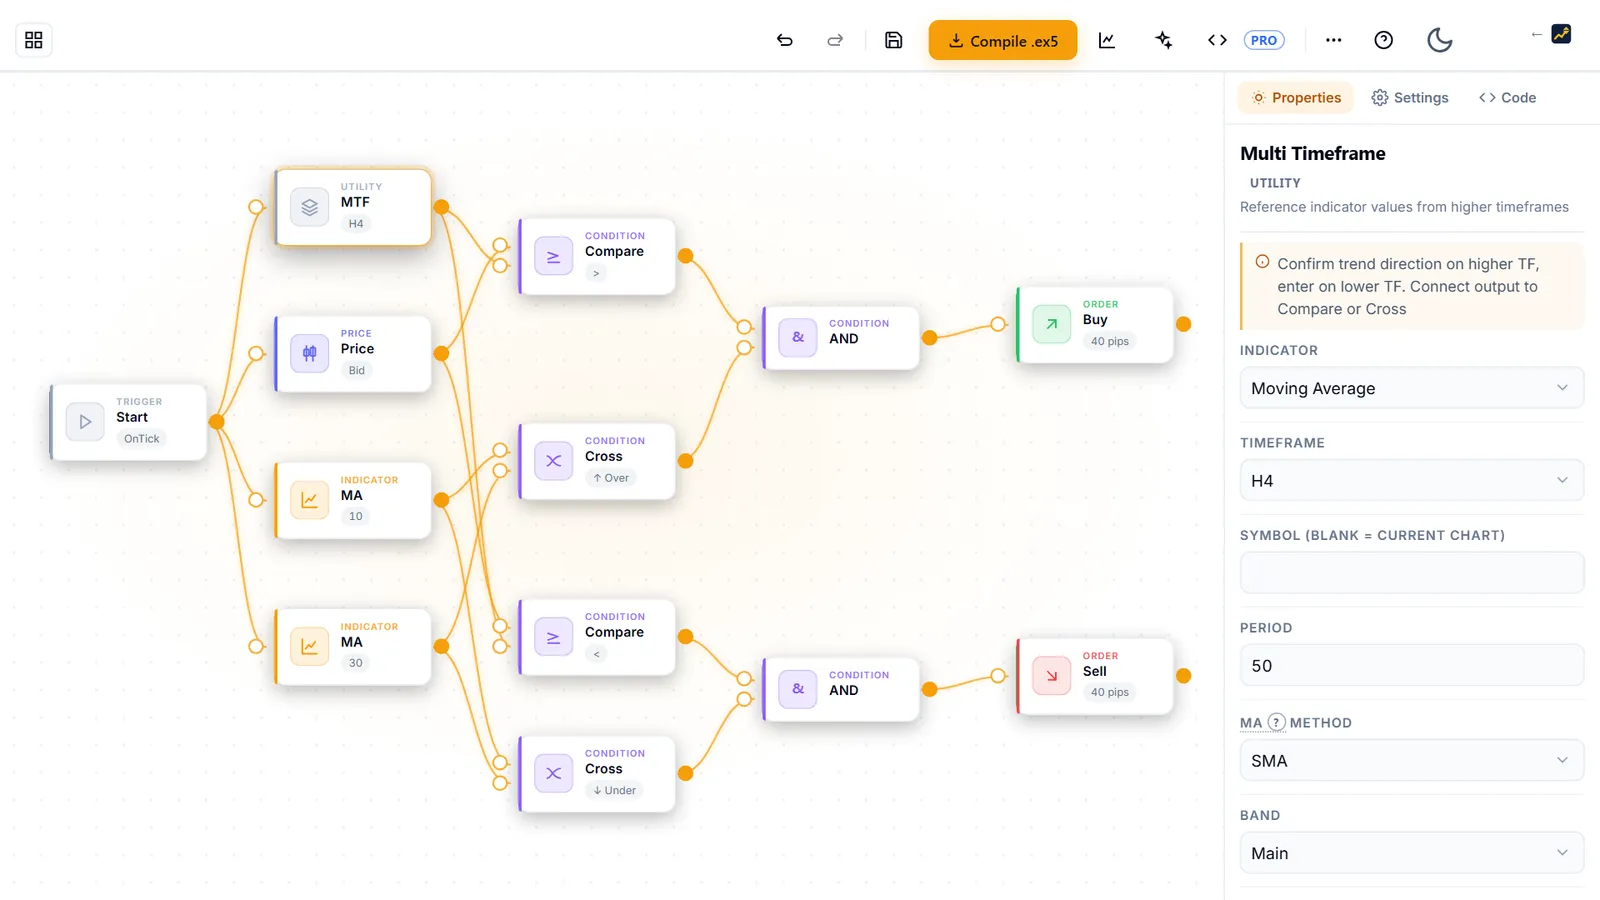
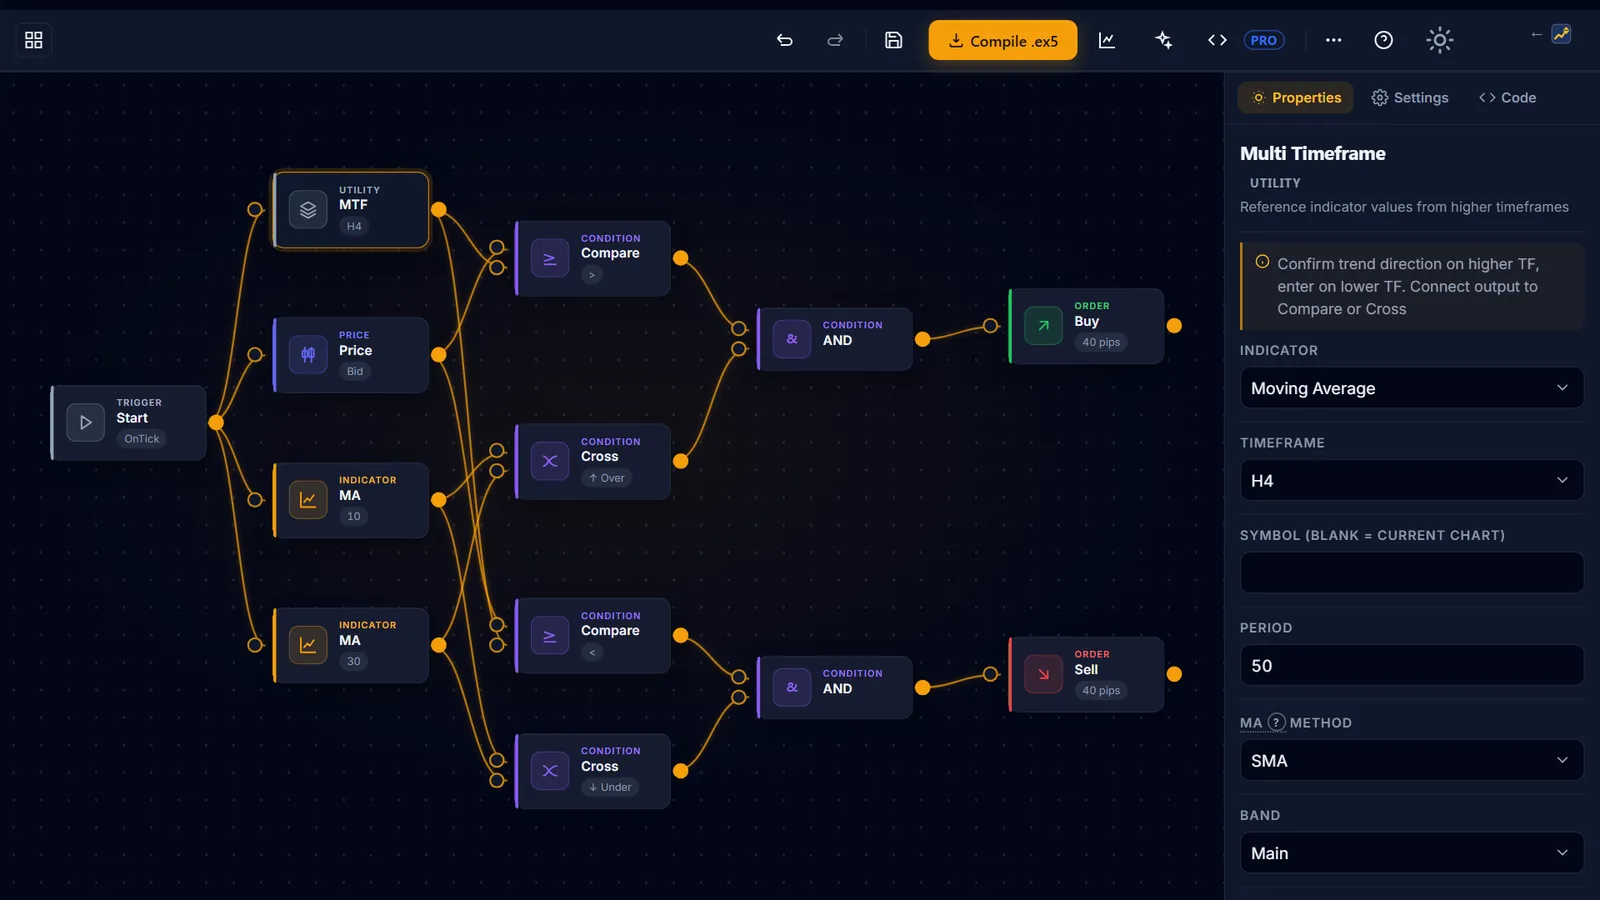
Trend and breakout are the shapes that turn the S&P’s drift and its US-open expansion into an asset. The practical route is to build one of these shapes yourself. The Builder ships trend and breakout templates and exposes every parameter, including the sizing inputs an index needs — then test it (below) before you trust a single number.
Best Trading Hours for US500 EAs
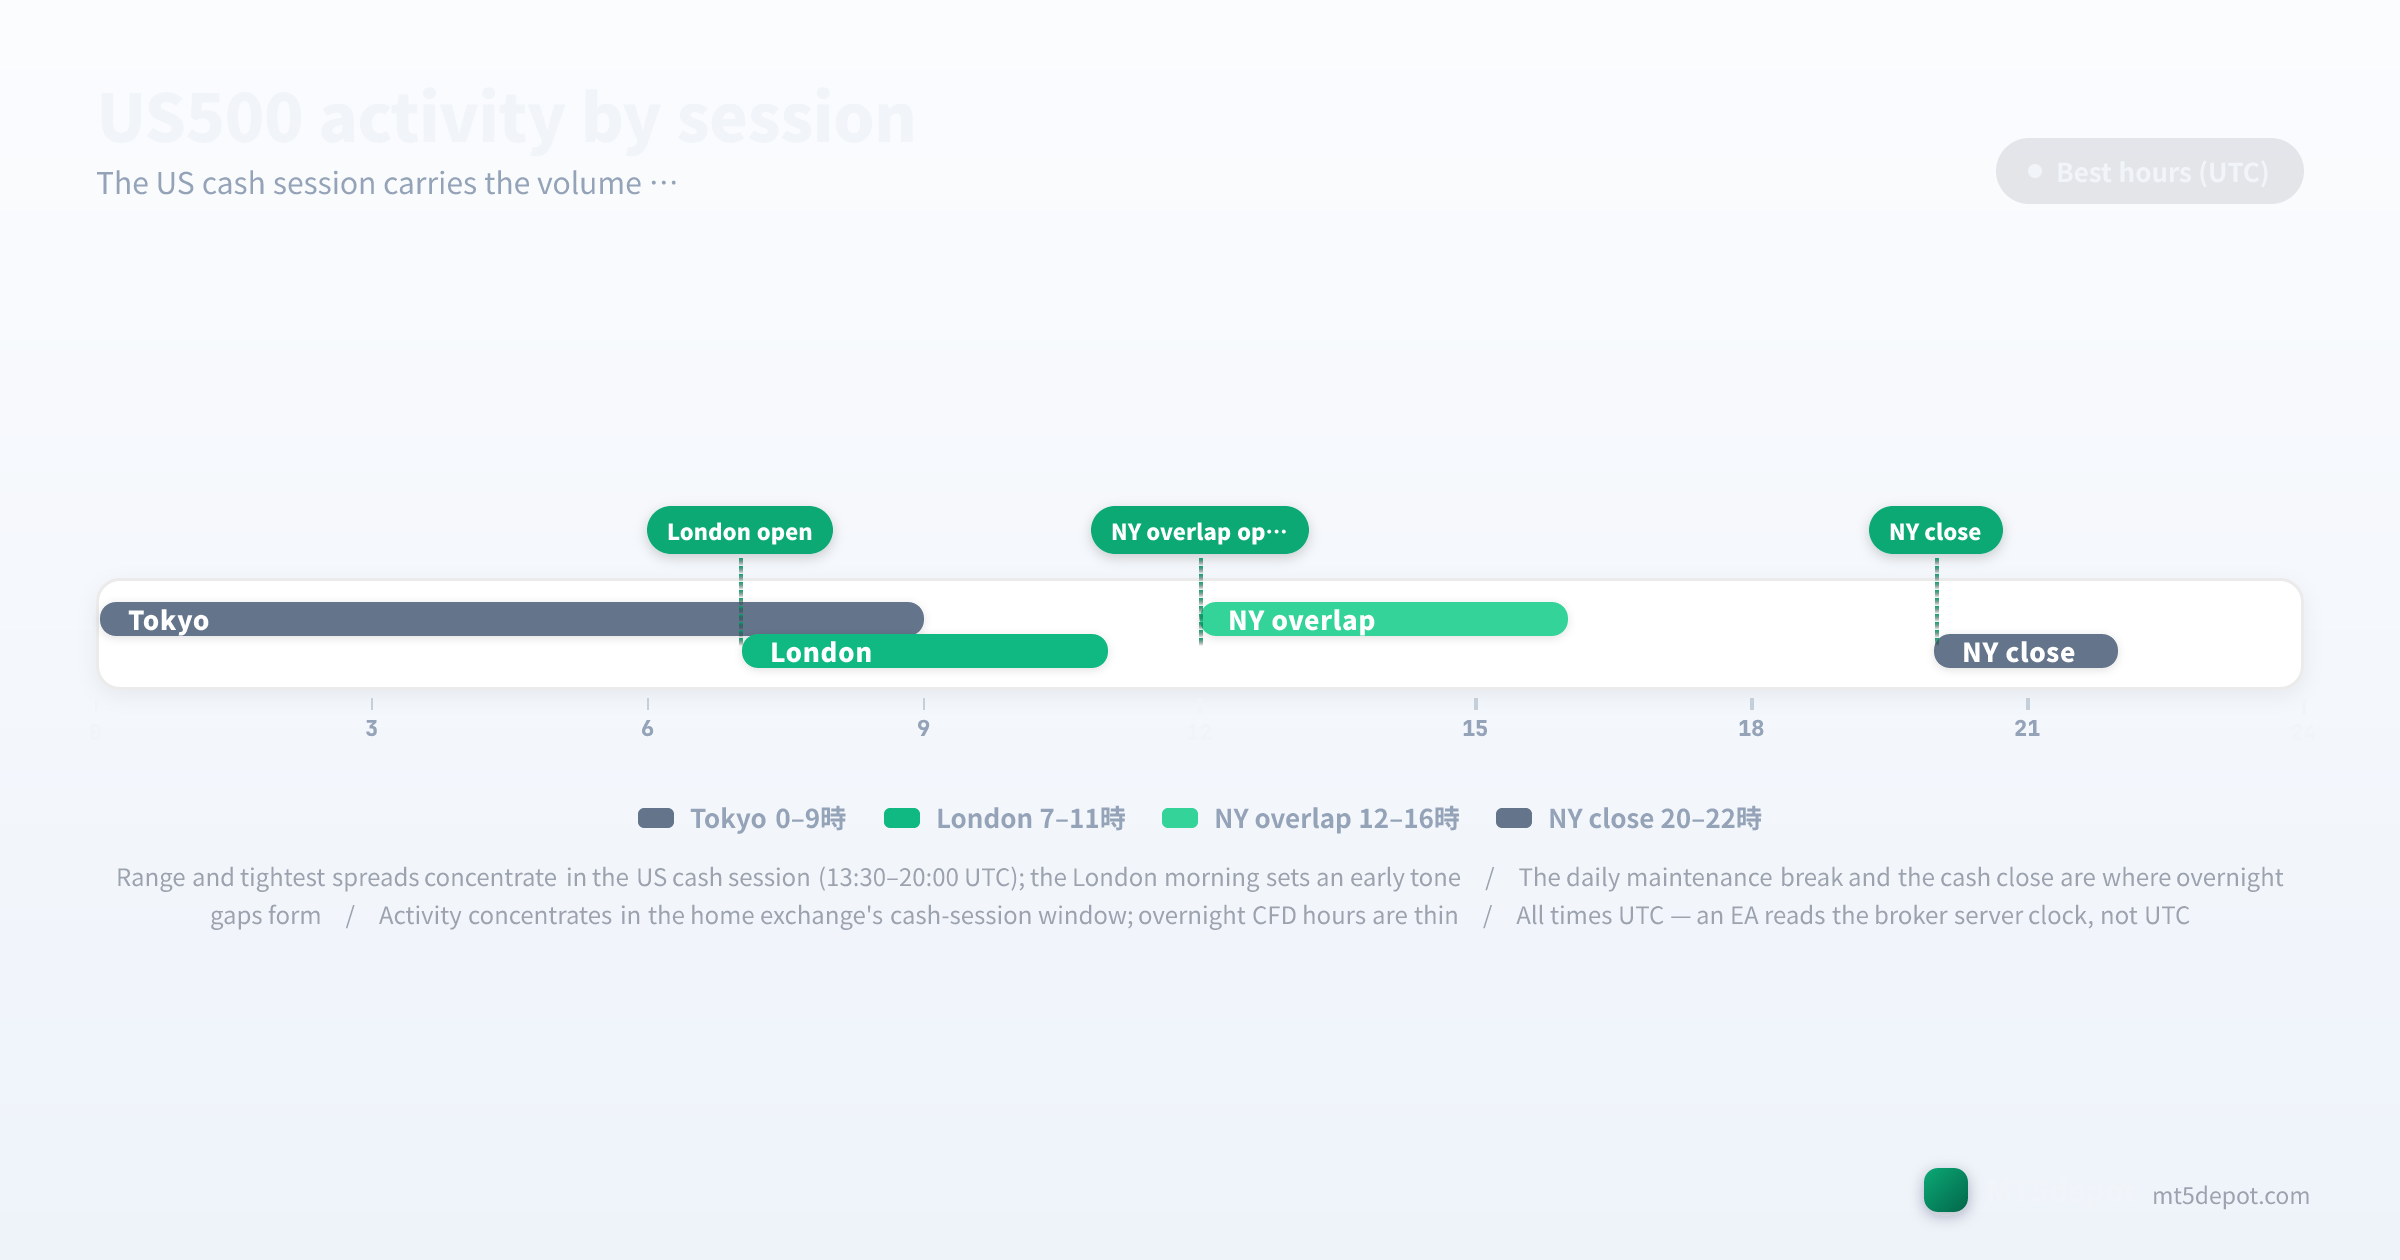
Session structure decides more of a US500 result than indicator choice does. An equity index — unlike forex — has a defined cash session that concentrates its volume:
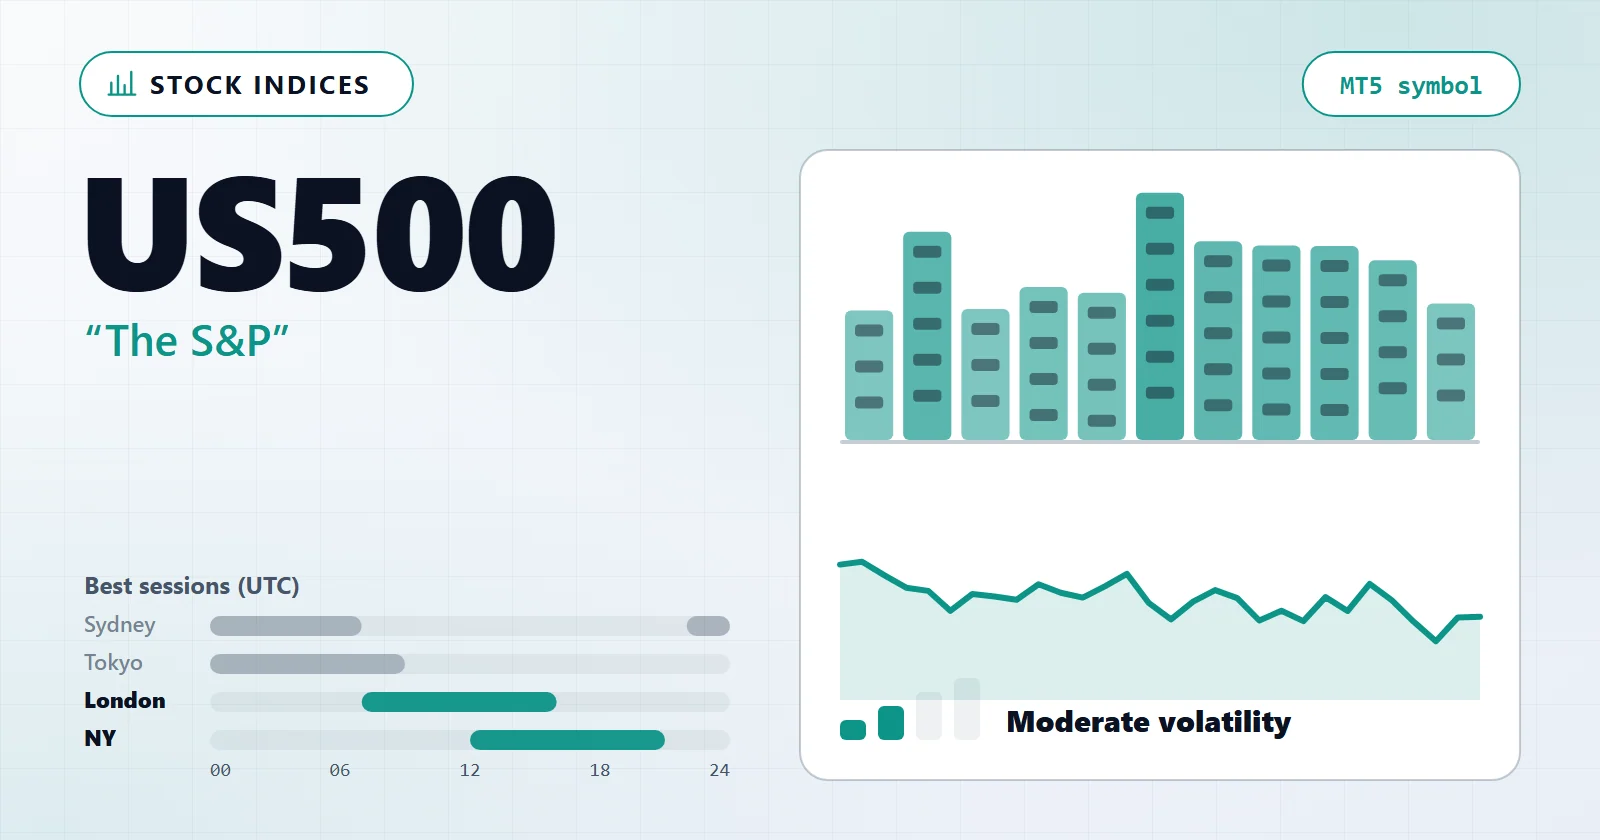
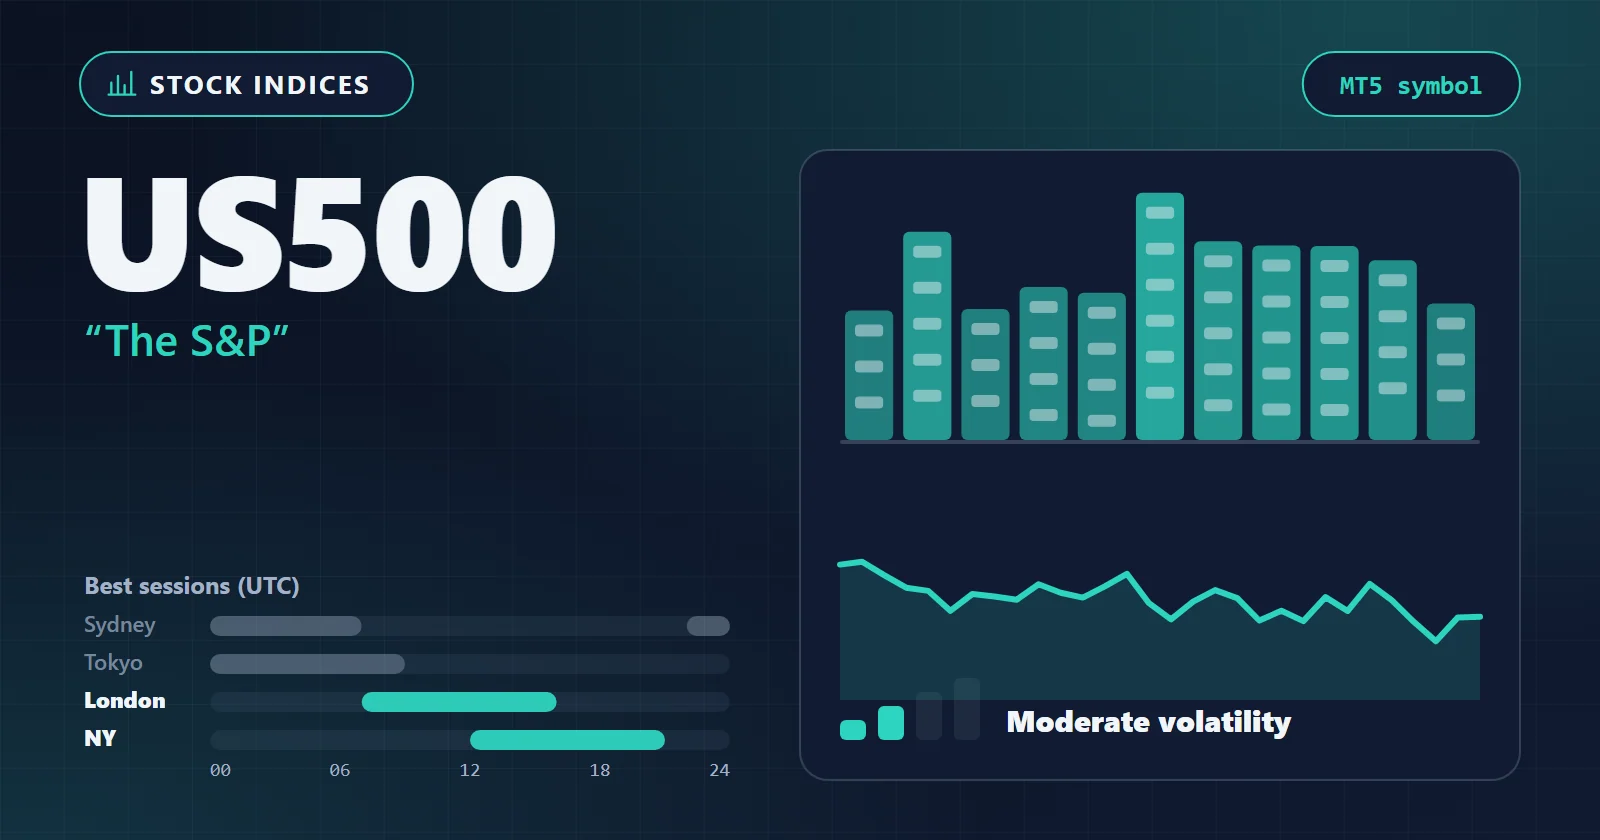
- London morning (07:00–13:30 UTC): the S&P CFD trades before the US cash open, but on thinner index liquidity. This window sets an early tone and reacts to European risk sentiment. Spreads tend to run wider, and moves are more prone to reversal once the US arrives.
- US cash open (around 13:30 UTC): the primary breakout window. The cash session opens with an expansion off the overnight range. Breakout and momentum EAs on the S&P tend to earn most of their result in the hours after this open.
- US cash session (13:30–20:00 UTC): the core window, where range and the tightest spreads concentrate. This is where a trend EA riding the drift finds its cleanest execution and its lowest cost.
- Cash close and the maintenance break: the danger zone rather than an opportunity. The daily maintenance break and the cash close are where the overnight gap forms. An EA holding through them is exposed to a jump the next session, not a continuous quote.
In our editorial assessment, EAs that restrict trading to the US cash hours often out-perform 24-hour variants on the S&P. Treat a session filter as part of the strategy definition rather than an optimisation flourish. Two cautions come with it. Scheduled US catalysts — FOMC decisions, CPI, and the earnings calendar — sit inside those good hours and widen the spread exactly then. A fast strategy needs a news pause, or it pays several times the normal spread at the worst moment. And every clock time above is UTC. An EA reads your broker’s server clock, which is usually not UTC, so a “13:30” US-open filter shifts silently when you move the EA between brokers on different server timezones. Verify it once in MT5’s Market Watch, and every session boundary lines up.
Spreads, Costs, and Execution
The cost of trading the S&P is quoted in index points, not forex pips. It also has a third component a currency pair does not — overnight financing on positions held past the daily rollover. The figures below are editorial reference midpoints compiled from broker-published index-CFD conditions (2026-07), not broker-by-broker measured numbers; our live spread sampling currently covers a few FX reference symbols. Confirm the live spread and the point value on your own account before you size anything:
| Cost component | Typical US500 figure | What it is | Who it bites |
|---|---|---|---|
| Spread | 0.4 – 0.7 points | The dealing cost per round trip, in index points | Every trade — heaviest on high-frequency systems |
| Commission | account-dependent | A per-lot charge on raw-type accounts, none on standard | Set by your account type, not by the index |
| Overnight financing | account-dependent | A rollover charge on positions held past the daily cut | Position-holding trend EAs, compounding over weeks |
Two cost rules specific to this instrument:
- Cost is in points, and financing is real. The spread above is measured in index points. A slow trend EA that holds through the daily rollover pays financing on top of it — a drag that never appears in a gross backtest but compounds over a multi-week hold. A US500 trend edge that looks profitable before financing can be flat or negative after it, so the charge belongs in the model, not a footnote.
- The commission and the financing are account properties, not index properties. The same raw-account commission applies whether you trade the S&P or any other index. What changes between instruments is the spread and the point value on top of it. A US500 EA validated on a commission-free standard account and deployed on a raw account with per-lot commission — or vice versa — is running a different strategy from the one you tested.
Risks to Test Before Going Live
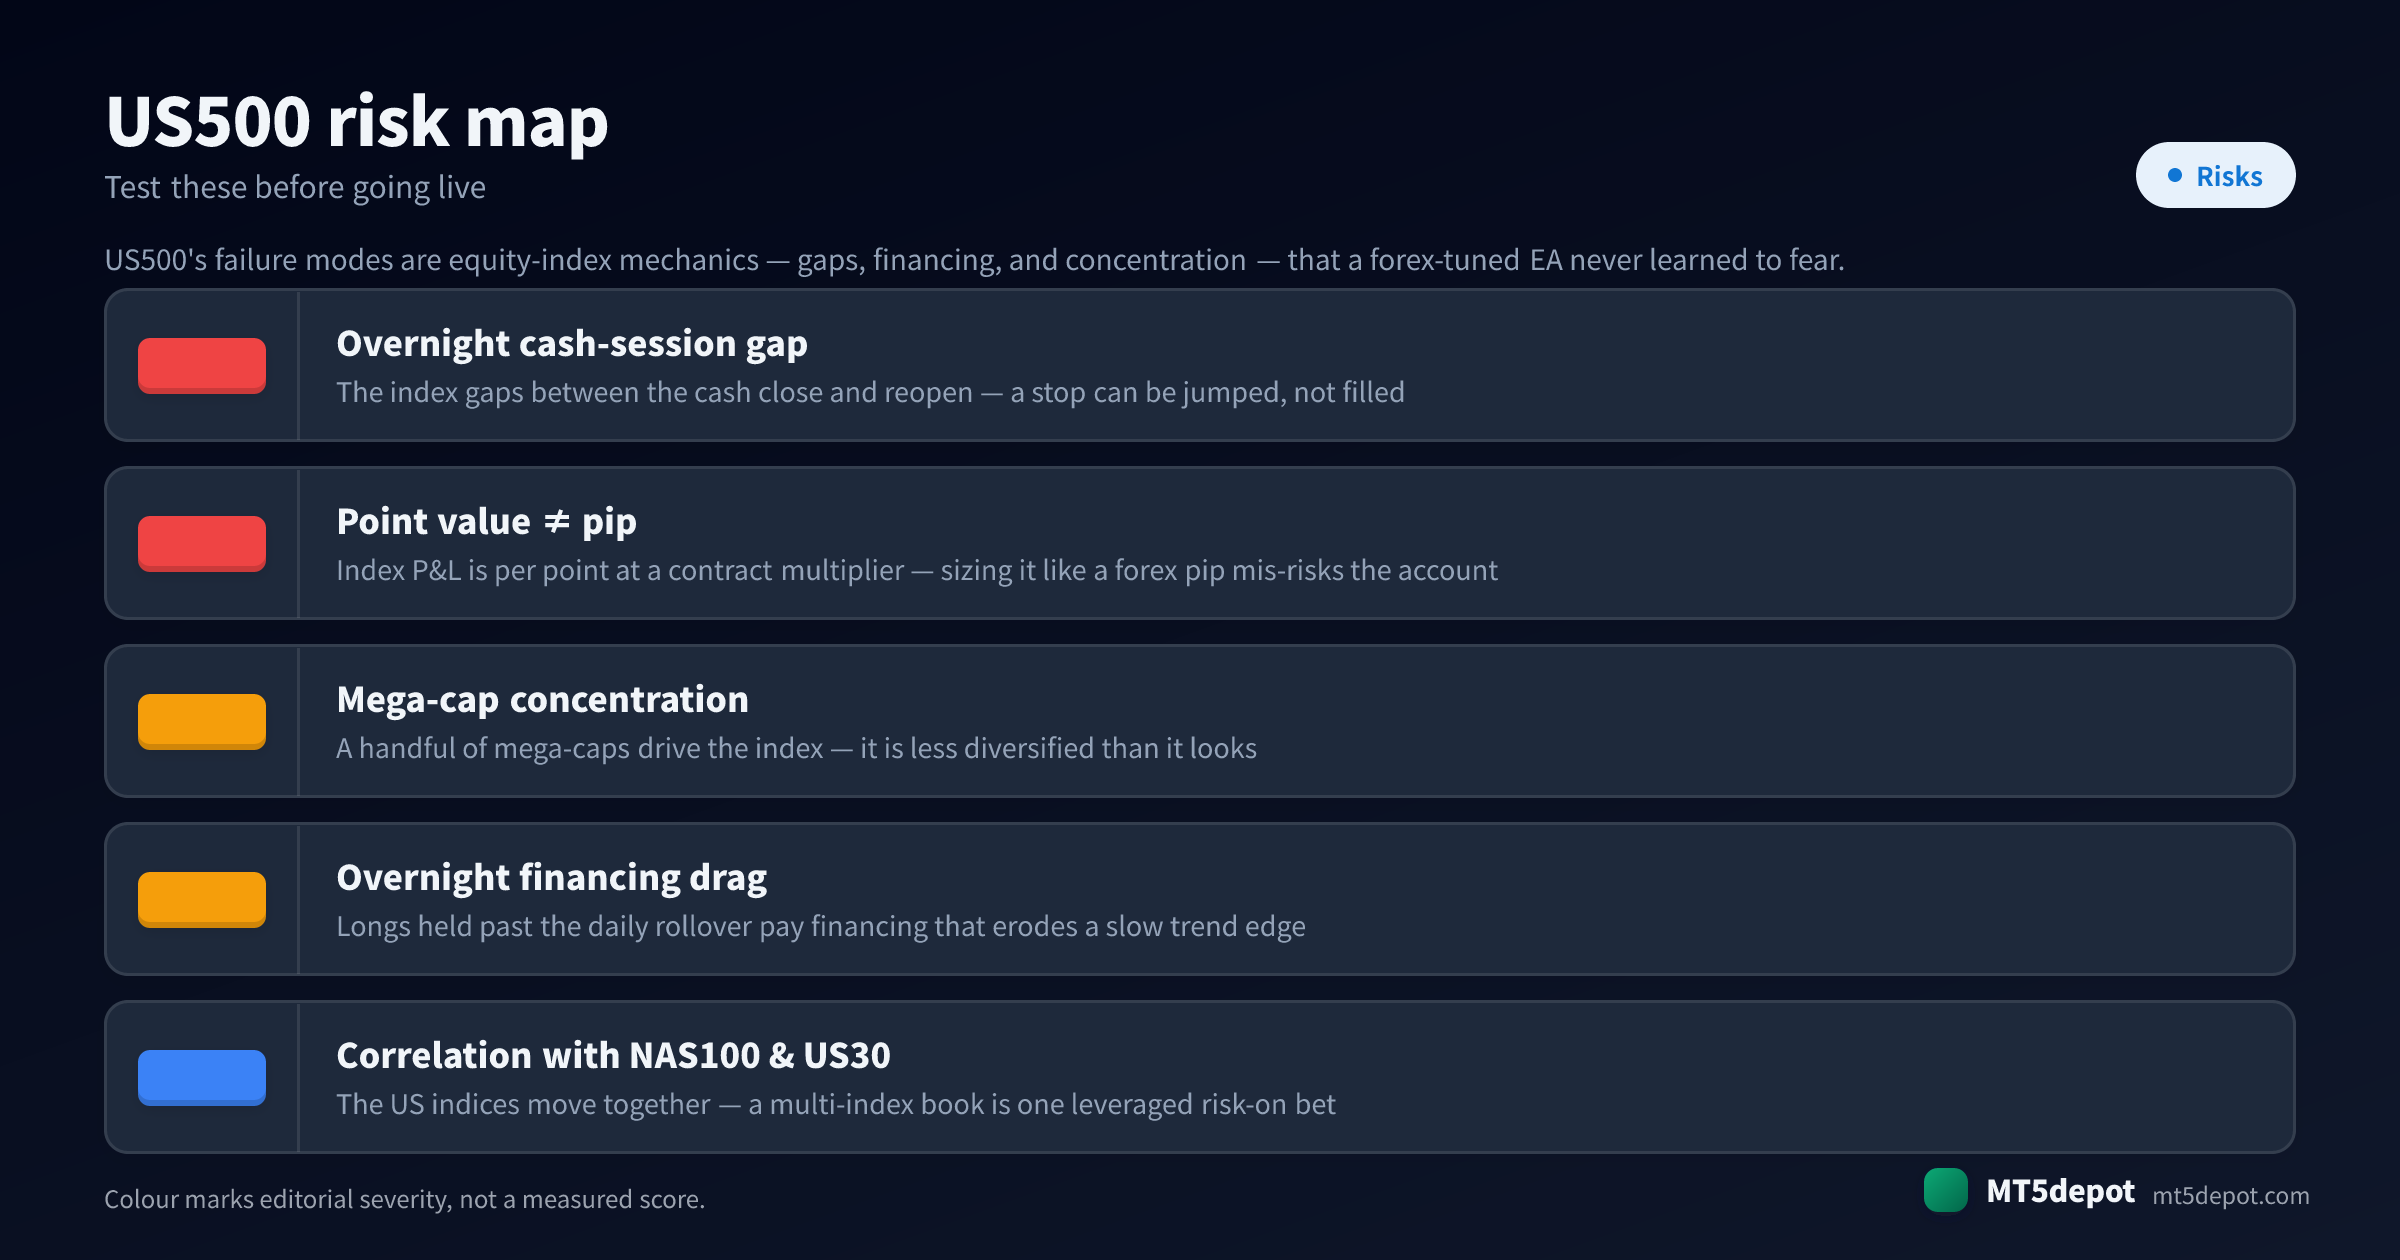
The S&P’s failure modes are equity-index mechanics — gaps, financing, and concentration. A forex-tuned EA never learned to fear them, and a generic risk checklist misses most of them:
- The overnight cash-session gap. The index gaps between the cash close and the reopen, so a stop sitting inside that gap is jumped, not filled at your level. The realised loss can be far larger than the risk the EA thinks it set. A 24-hour forex EA assumes continuous quotes and reliable stop fills, so it has never modelled this. Confirm your backtest actually reproduces the gap before you believe its drawdown figure.
- Point value is not pip value. Index P&L accrues per point at a contract multiplier. Sizing a US500 position as if each point were a forex pip mis-risks the account — sometimes badly. Confirm the point value your lot size implies, and read the drawdown in account-currency terms, not points, before you fund a single trade.
- Mega-cap concentration. The S&P is capitalisation-weighted, so a small cluster of mega-caps carries an outsized share of the index. It is less diversified than the “500 companies” label suggests. An EA trading the index is implicitly betting on those few names, and a single mega-cap earnings surprise can swing the whole tape in a way a broad-market assumption never priced in.
- Overnight financing drag on a slow edge. A long held past the daily rollover pays a financing charge that compounds over a multi-week trend. A slow edge that clears in a gross backtest can be erased once financing is applied, so a position-holding US500 EA must be tested net of it.
- Correlation with NAS100 and US30 is hidden leverage. The US indices move together as one risk-on complex. A “diversified” book across US500, NAS100 and US30 is closer to one leveraged bet on US equities than a hedge. The correlation does not appear in any single EA’s risk settings, which is how a three-index portfolio quietly triples exposure to the same move.
How to Test a US500 EA
On US500, the test is the whole edge. Hold anything you build to the bar set out in the site’s methodology:
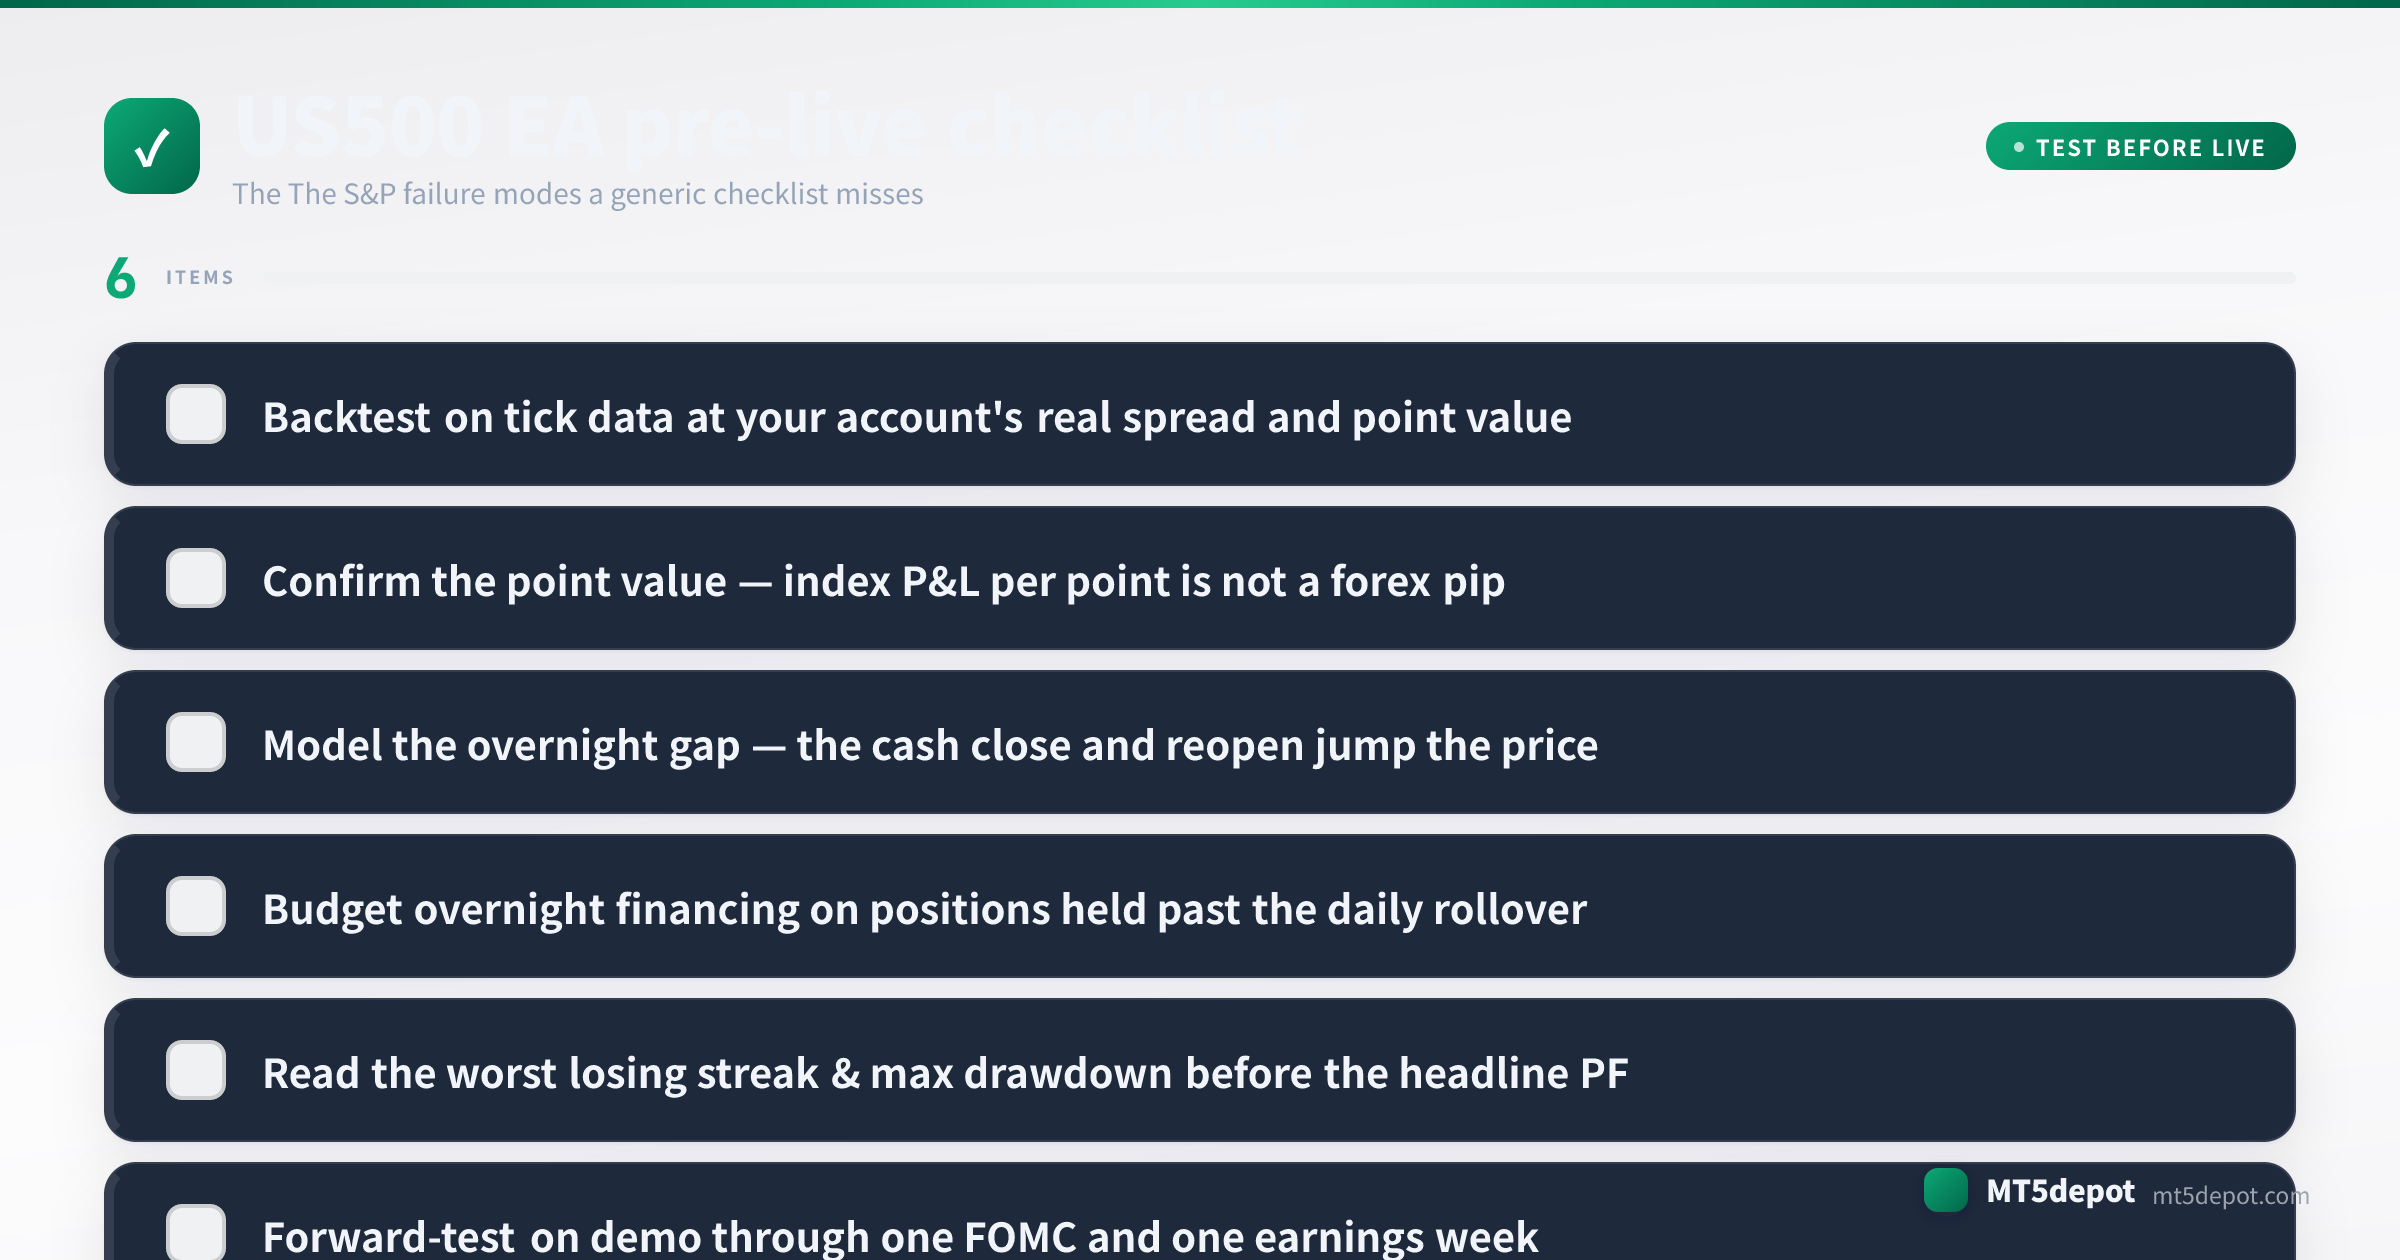
- Backtest on tick data at your account’s real spread and point value. Use an every-tick model with your account’s real spread — typically 0.4–0.7 index points here, not the platform default. Confirm the model reproduces the overnight cash-session gap. A test that treats the price as continuous skips the mechanic most likely to blow past a stop.
- Confirm the point value, then read the worst losing streak. Verify the per-point value your lot size implies is one you can survive — index P&L is not a forex pip. Then read the max drawdown and the longest run of losing trades in account-currency terms. Budget for the worst streak before you fund it, and make sure the backtest was net of overnight financing.
- Forward-test on demo through one FOMC and one earnings week. The S&P’s defining risks — a rate surprise and a mega-cap earnings gap — only show up around those catalysts. A demo window that never spans an FOMC decision or a heavy earnings week has not tested the thing most likely to hurt.
- Confirm the server clock before the first live trade. Re-check MT5’s Market Watch time against the UTC session hours above, and re-check it after any broker migration — easy to skip, expensive to miss.
Every backtest number this produces is a historical measurement, not a forecast — size for the drawdown you measured, not the return you hope for.
US500 EAs and Builder Templates
We have not published a US500 backtest of our own, and a forex result does not carry over to a stock index — the gap, financing and point-value mechanics above mean the two are not interchangeable. The honest route to an S&P EA is to build and verify one:
- The Builder (open it here) ships trend and breakout templates and exposes every parameter, including the sizing inputs an index needs. The EA you deploy is built on your own point value and your own numbers.
- Broker and account fit. The S&P’s spread, commission, financing and point value all depend on the account. Check those conditions on your own broker before you size anything.
- A forex EA is not a starting point. If you already run a forex EA, do not port it across. None of the gap, financing or point-value mechanics above exist in its test, so rebuild the shape for the index and test it from scratch.
- The concept canonicals. If a term above is unfamiliar, the volatility, ATR and leverage entries define the mechanics a US500 EA depends on most.