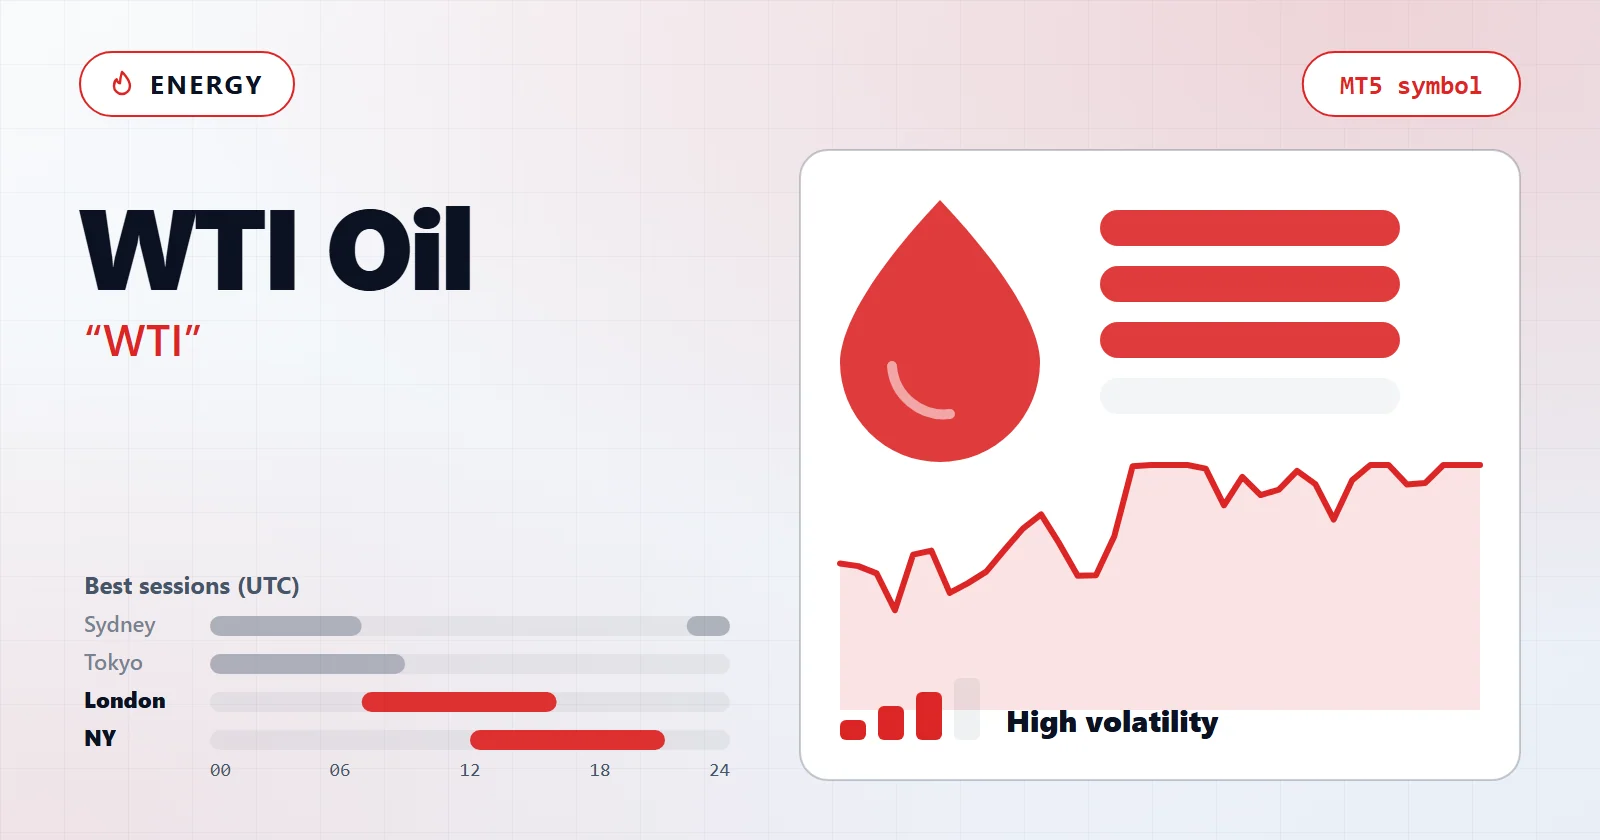
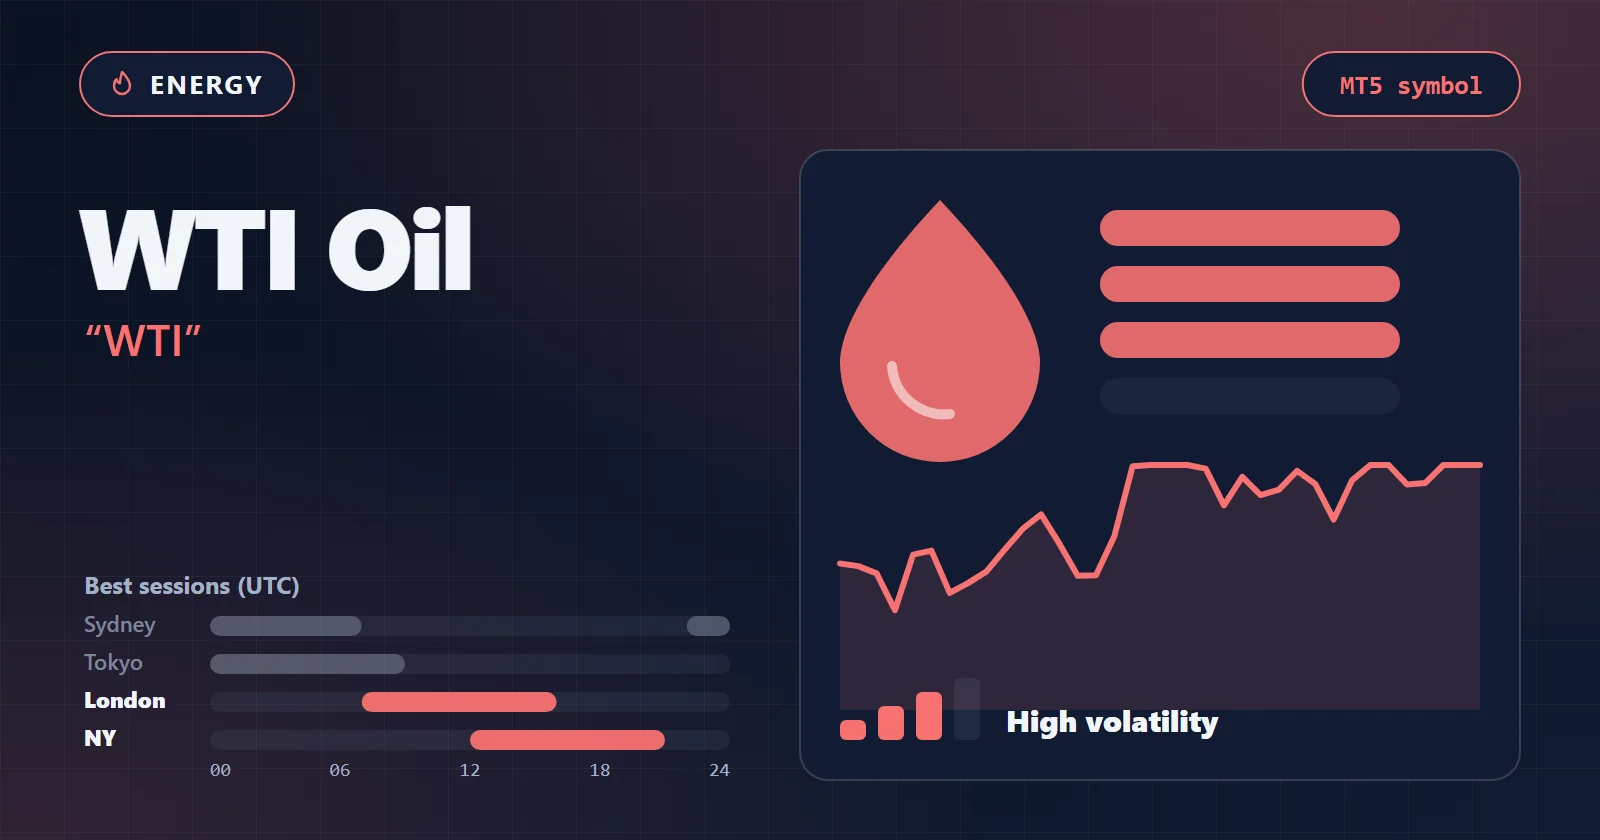
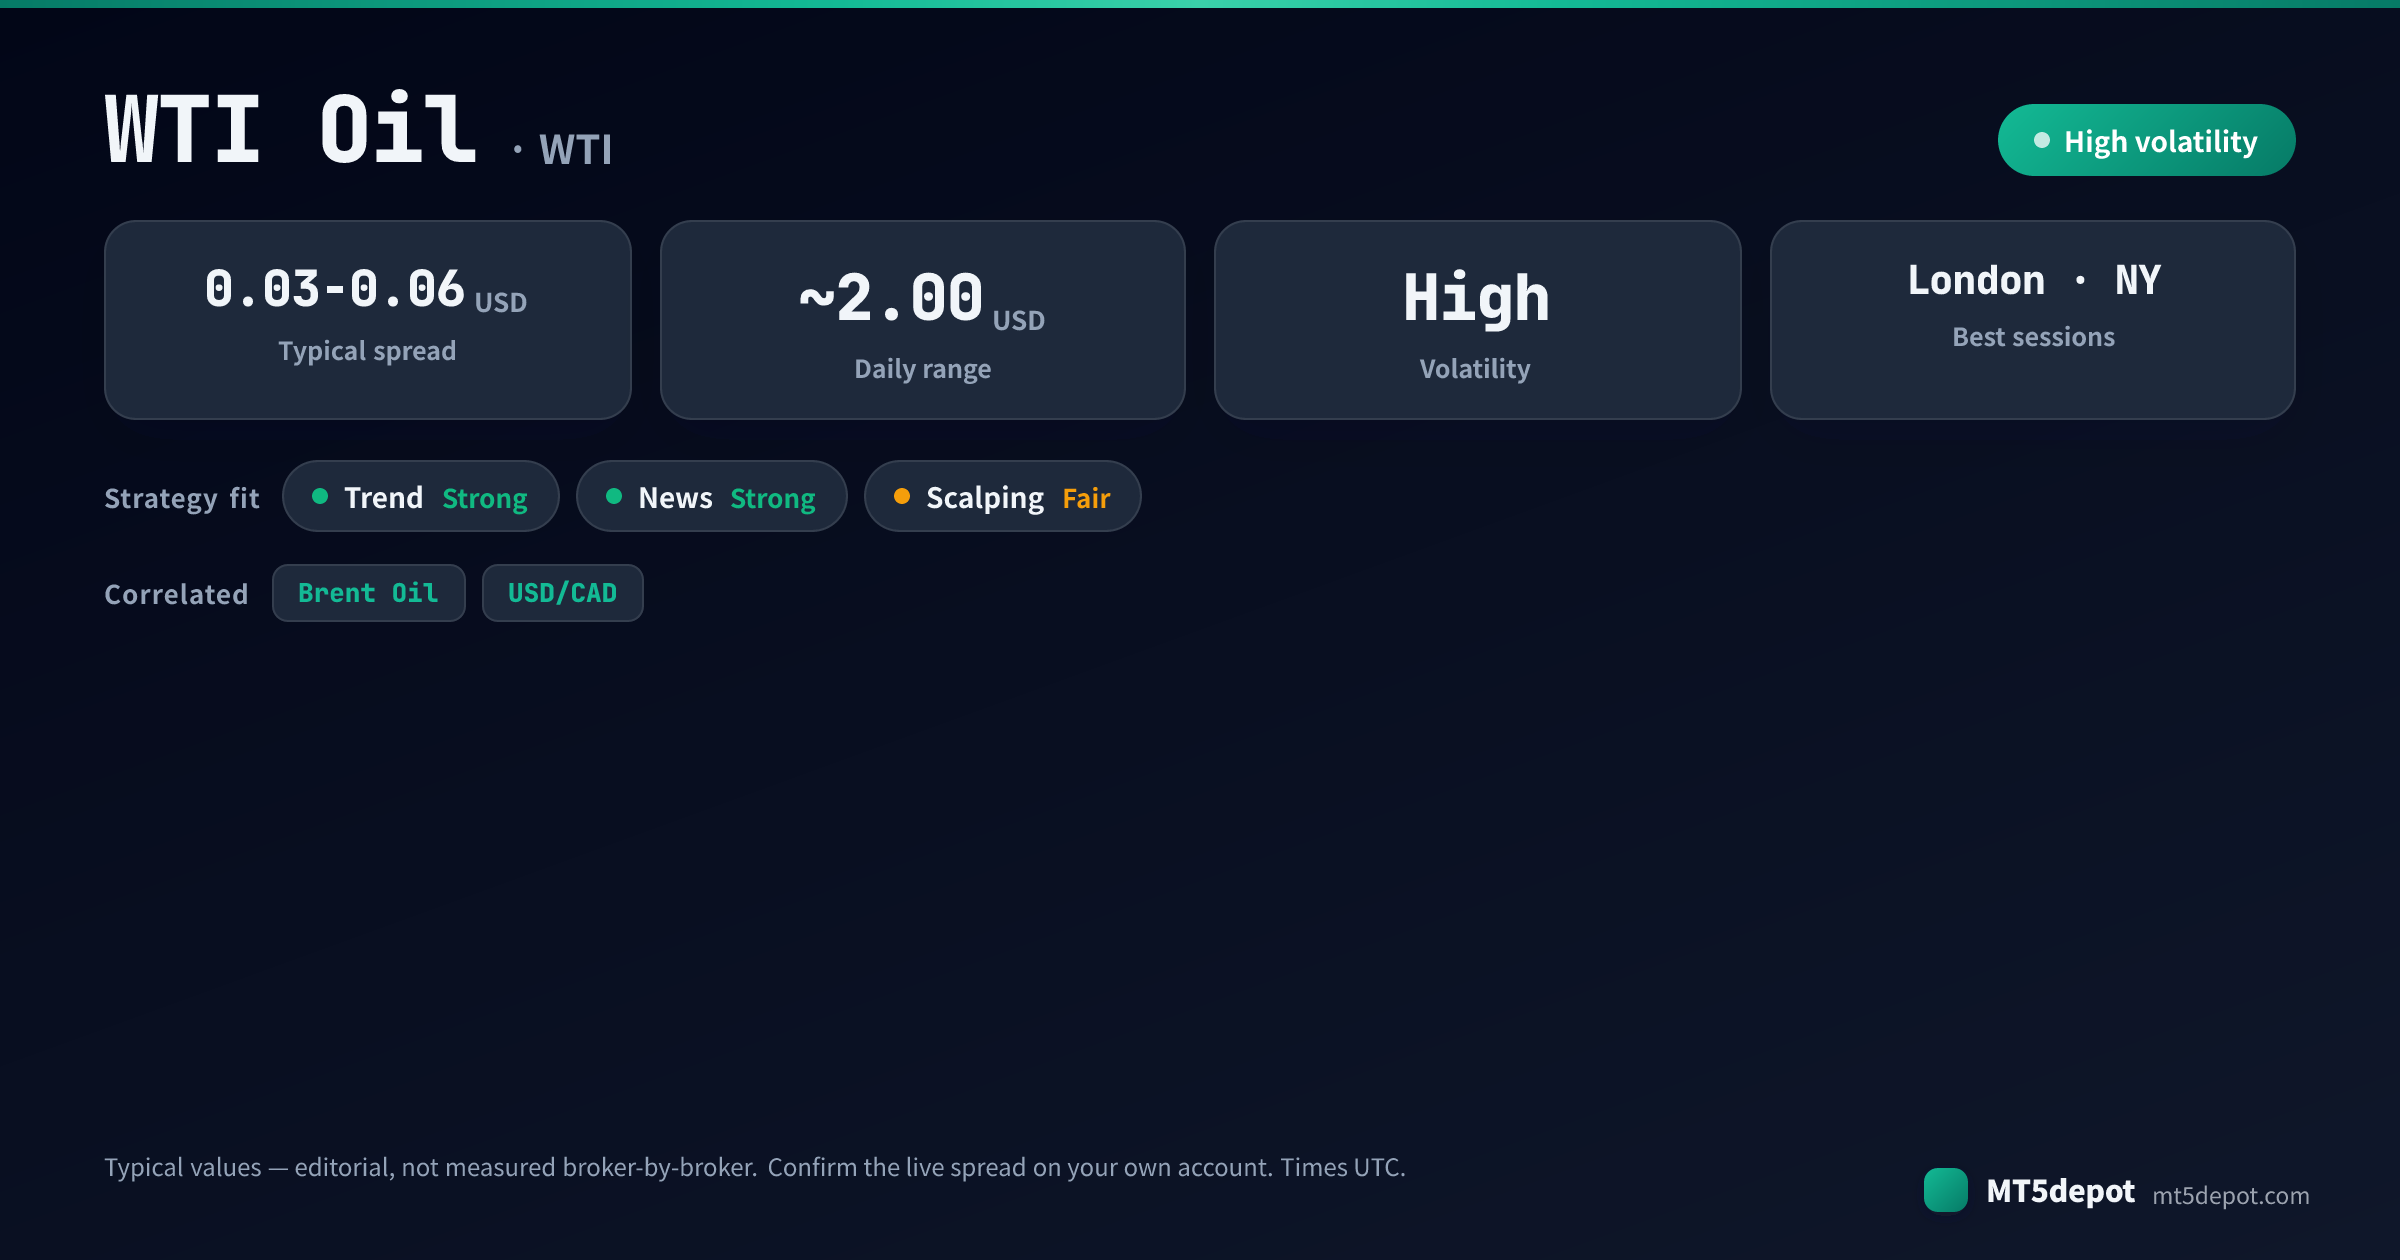
WTI Oil is not a currency pair. It is West Texas Intermediate crude, the US oil benchmark, quoted as a dollar price per barrel and traded through a CFD that tracks the front-month futures contract. What moves it is an oil calendar — weekly US inventory data, OPEC supply decisions and geopolitics — not an interest-rate differential. Against its near-twin Brent it is the more domestically-driven, storage-sensitive of the two benchmarks. The first thing to decide is whether your strategy wants that character or merely tolerates it. A trend or event-paused EA can feed on oil’s supply-driven moves, while a system built for the tidy rhythm of a forex major meets scheduled inventory jolts, contract-roll gaps and a documented history of the price collapsing below zero.
This page covers what WTI gives an automated strategy that a forex pair does not, the sessions that decide its results, and what it costs in dollars per barrel. It then covers the failure modes that catch ported FX systems, and how to build and test an oil EA of your own.
How WTI Oil Behaves: What WTI Gives an EA
WTI is structurally different from a forex major in a way that matters more for automation than any indicator choice. Its catalysts and its contract mechanics both sit outside the FX world an EA was probably designed for.
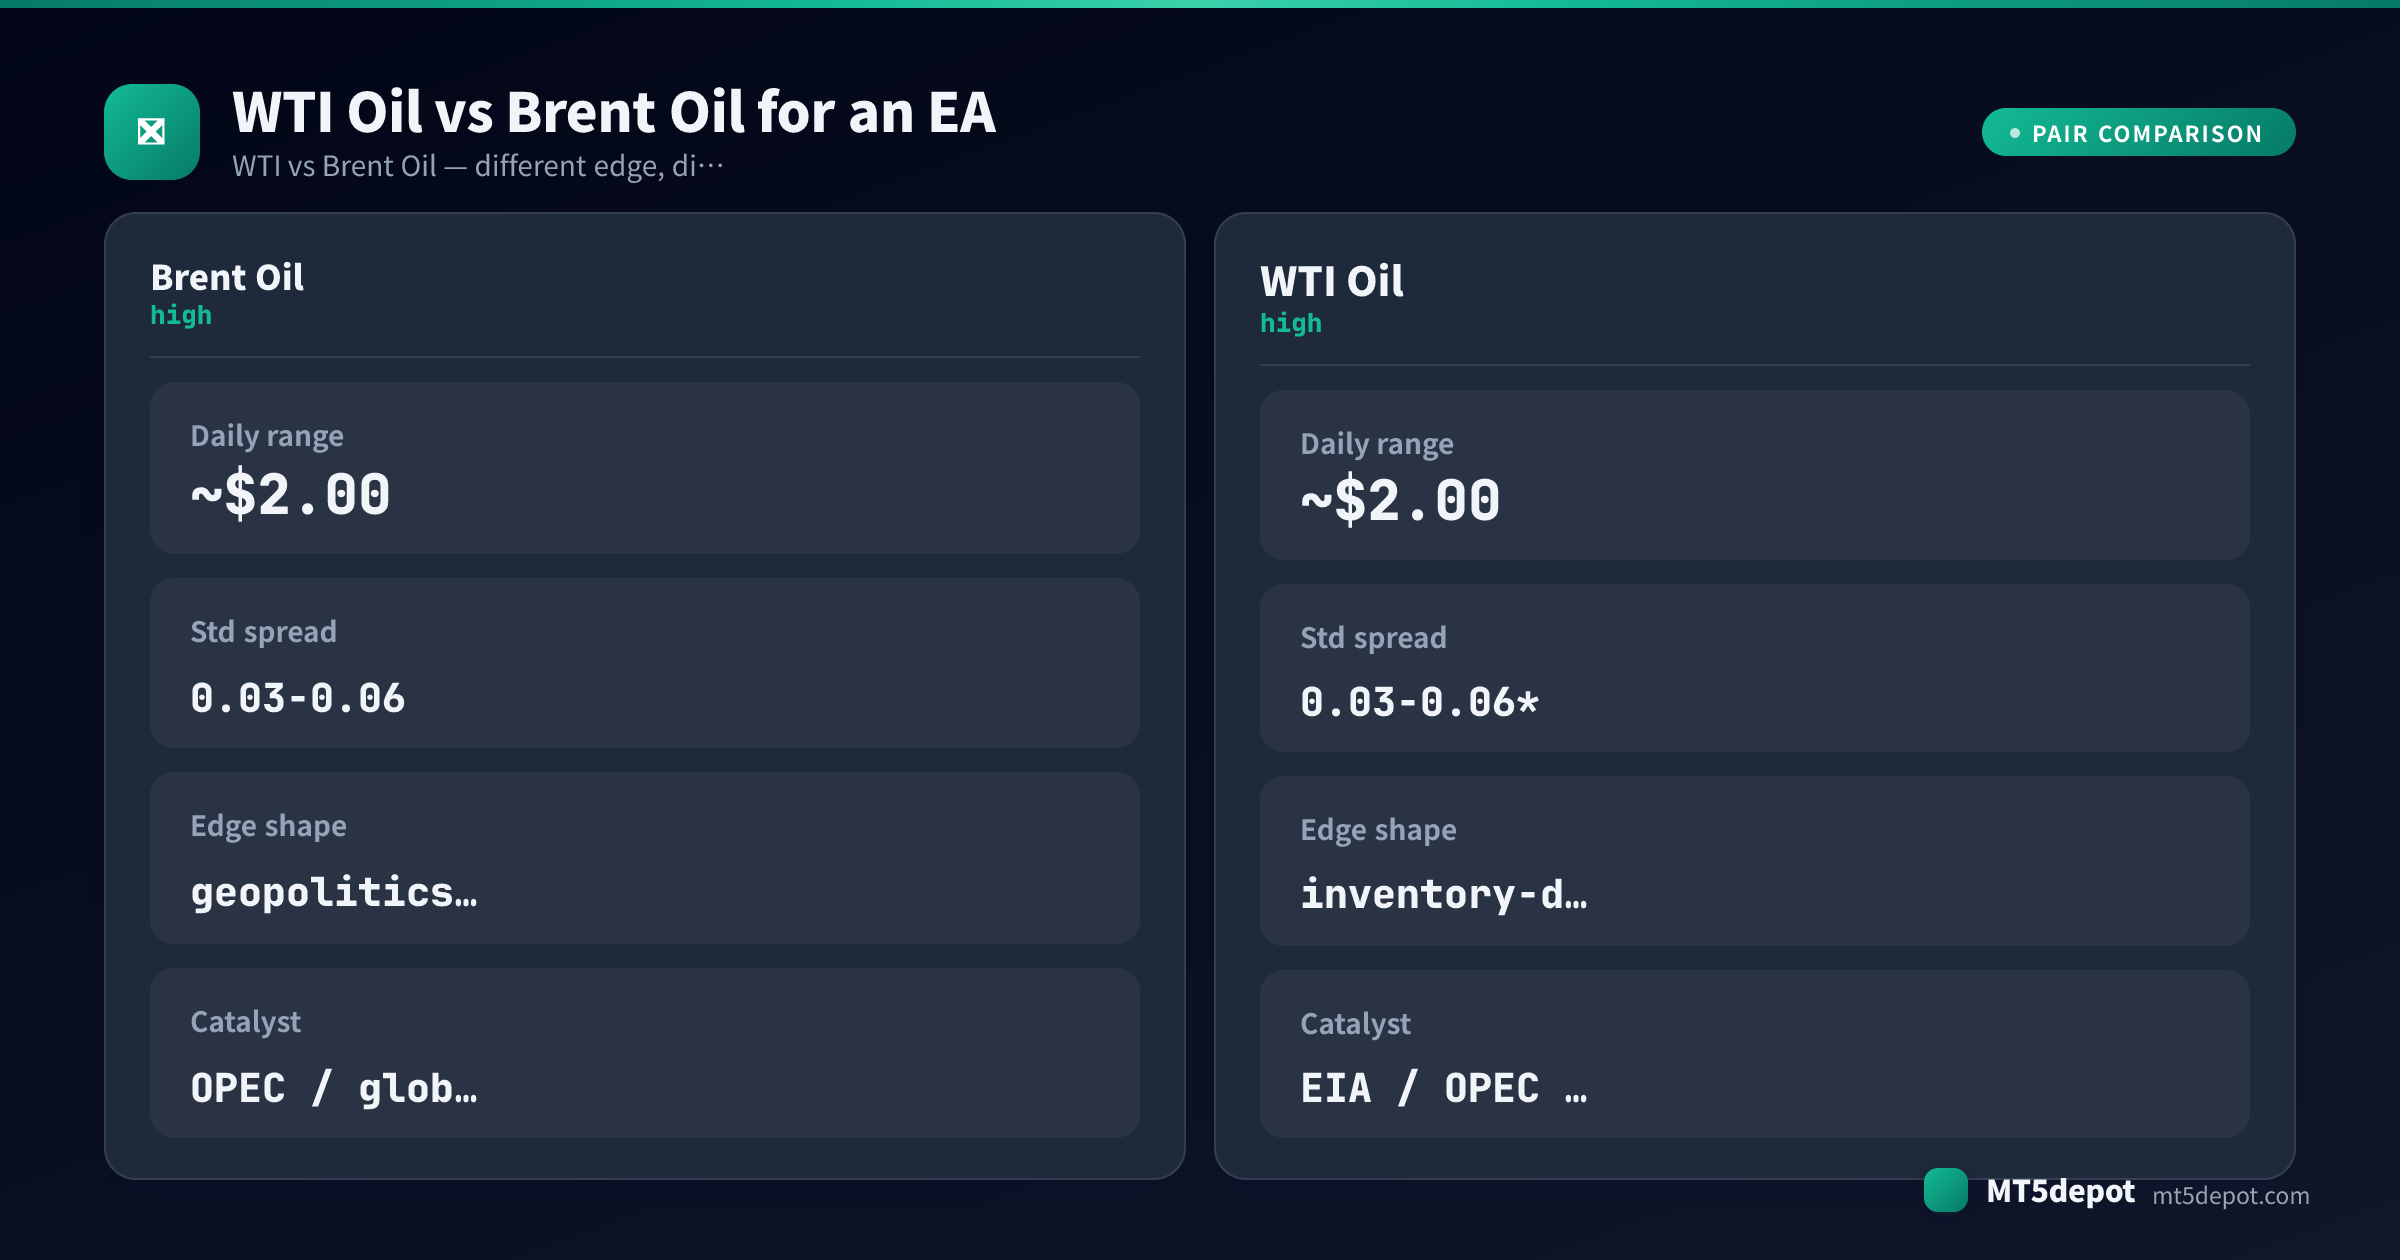
For an EA, that character reduces to three properties:
- A scheduled weekly jolt built into the calendar. The US Energy Information Administration releases its crude inventory figures every Wednesday at roughly 15:30 UTC, and a surprise print routinely moves WTI a dollar or more per barrel in seconds. An oil EA that ignores this weekly event holds a known landmine, and most FX EAs are blind to it because it has nothing to do with a currency calendar. Our published typical daily range for WTI is near 2.00 USD per barrel — labelled typical, not measured broker-by-broker — and one inventory surprise can consume a large slice of it at once.
- A contract underneath the price. The CFD tracks the front-month futures contract, so the instrument has an expiry the way a currency never does. When the front month rolls to the next, the CFD price can gap or take a cash adjustment, and a price-only EA can read that discontinuity as a tradeable move. Contract structure, not the entry signal, is what makes oil behave unlike a spot FX pair.
- Supply-and-geopolitics catalysts, not FX ones. OPEC decisions, pipeline and refinery disruptions and Middle-East risk premia drive WTI, and they can reverse a multi-week trend with nothing on the forex calendar to warn a price-only system. A trend EA reading price alone often has no idea the supply story behind its position has just flipped.
The trap is that WTI’s large, clean supply-driven moves look like an easy trend edge on a backtest. The same instrument hides a scheduled weekly jolt, an expiring contract underneath the chart, and a standing piece of history — the April-2020 dip below zero — that a currency EA never has to model. WTI rewards strategies that respect its volatility and its calendar, and quietly ruins ones that treat it as a forex pair with a bigger number.
Which EA Strategies Suit WTI Oil?
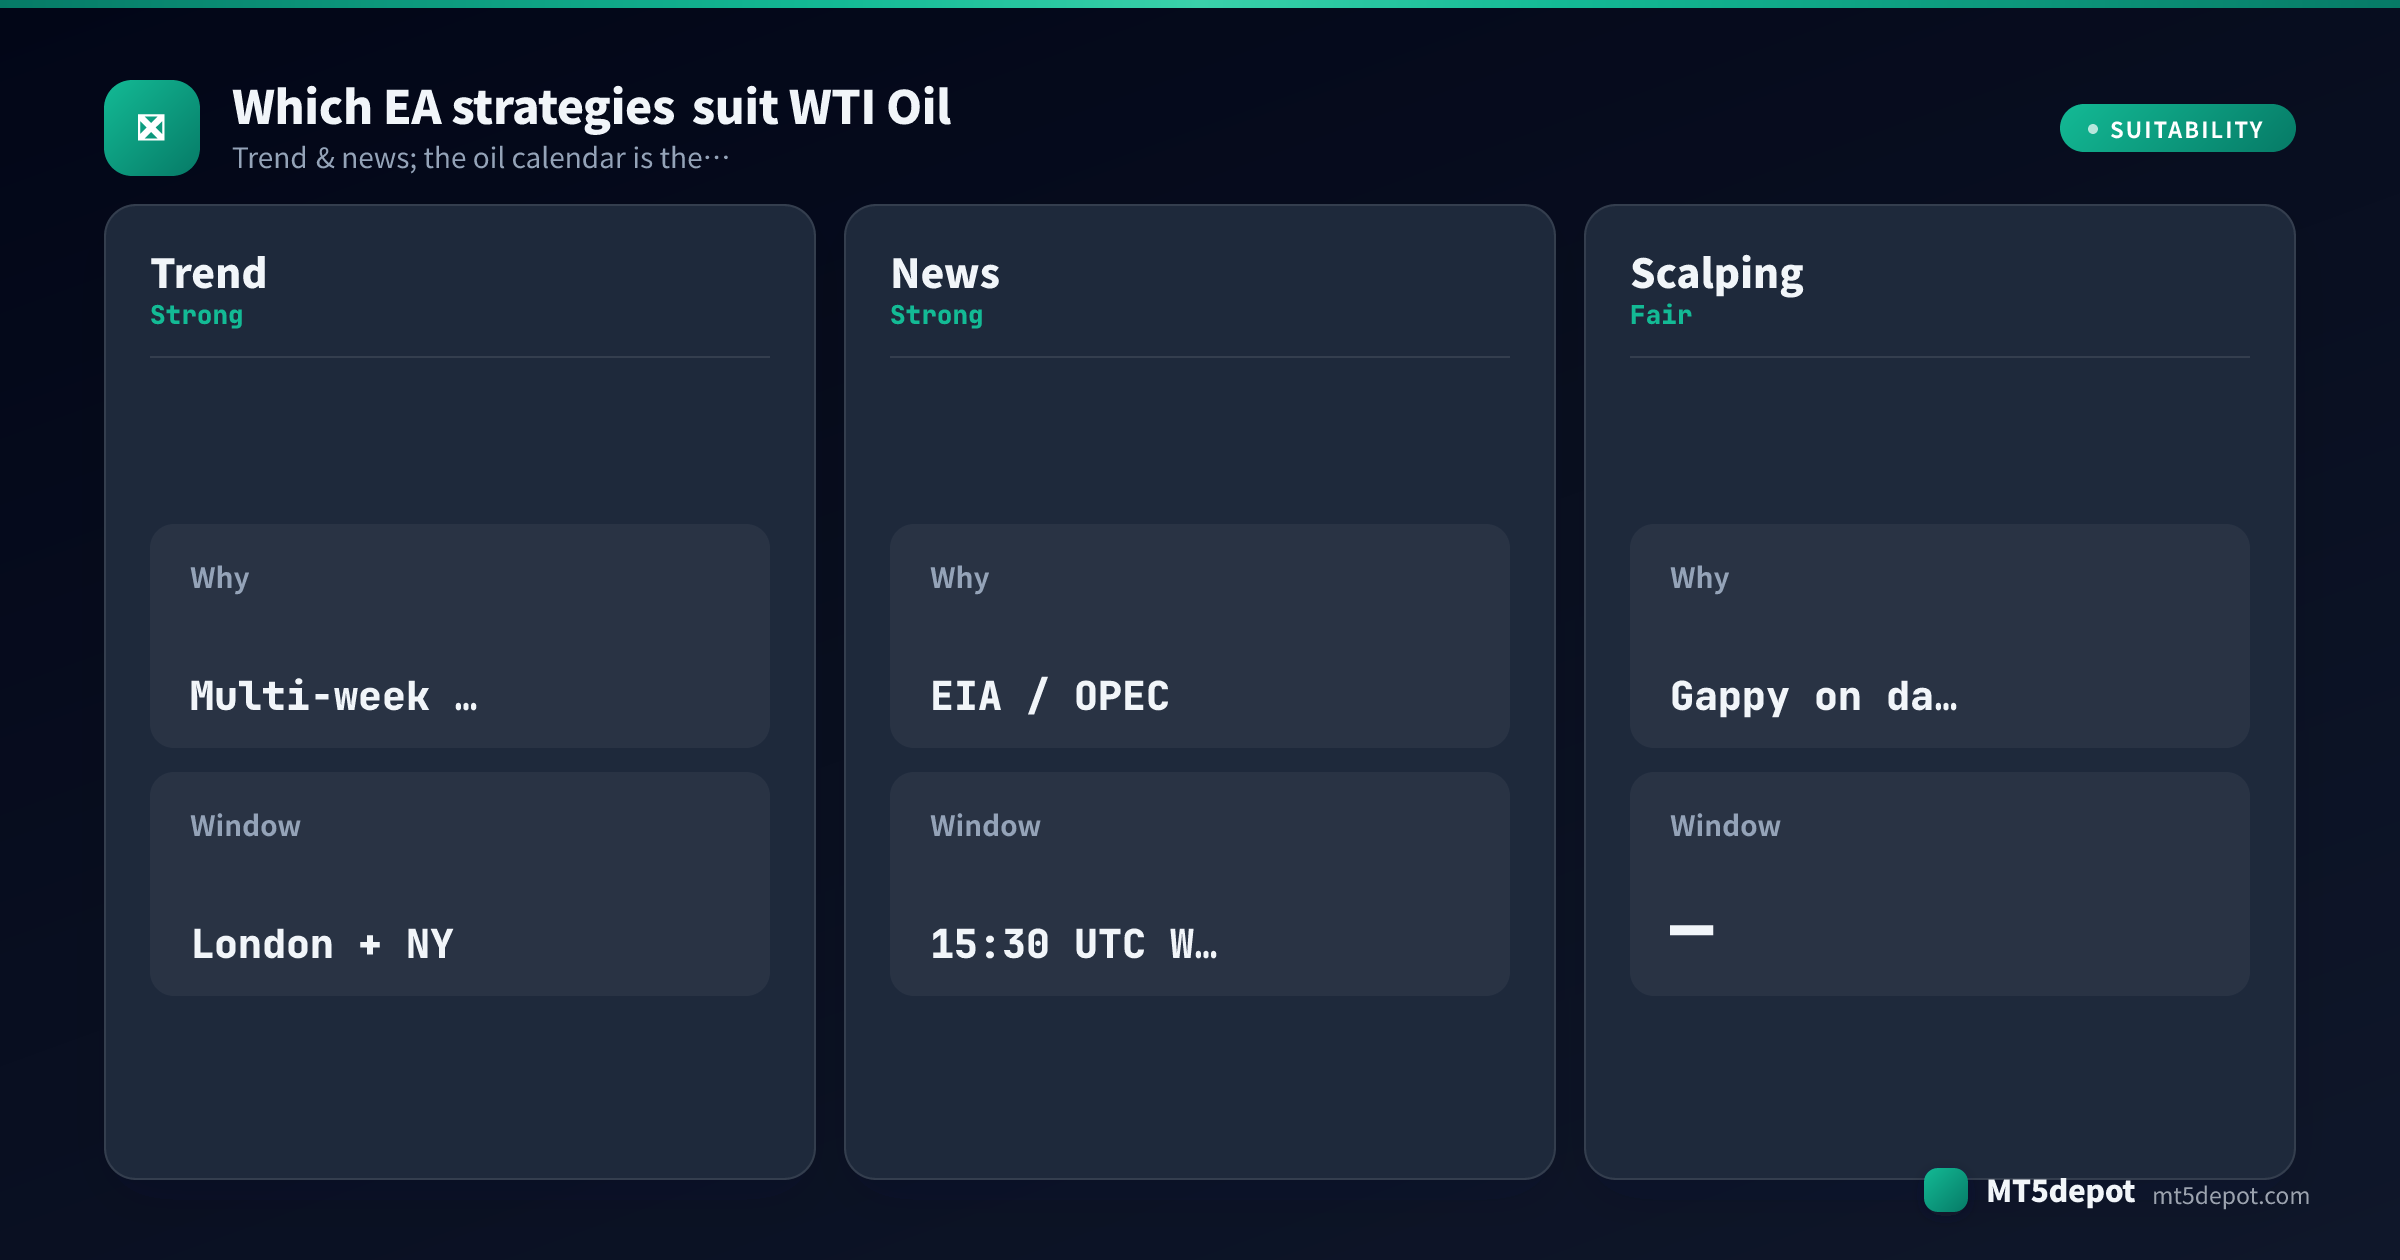
The instrument’s profile lists trend and news as suitable — but suitability is an editorial assessment, not proof. In our own stock-settings baseline of the Builder’s templates — a single USD/JPY M5 run over one year, default inputs, no optimisation — most finished below a 1.0 profit factor, and that run was not on WTI. Almost none cleared the Builder’s own bar at stock settings, so treat any edge on WTI as something your own settings and test have to earn. Look for it in mechanics — timeframe, event pauses, gap handling — not the indicator on the box. What WTI’s character tends to support:
| Strategy | Fit on WTI Oil | Why |
|---|---|---|
| Trend | Strong | Oil’s supply-driven moves run for weeks; momentum systems on M15–H1 get room for a 2:1 or 3:1 target, and the ~$2.00 daily range gives it space to fill. |
| Event-paused | Strong | The scheduled EIA print and OPEC headlines are objective, dated catalysts; a system built to pause before them and act on the resolution uses the oil calendar as an asset. |
| Scalping | Fair | The tight 0.03–0.06 USD spread helps, but oil gaps hard on data and roll dates, so tight stops get jumped. Treat any oil scalper as unproven until a tick-data test through an inventory print says otherwise. |
Trend and event-paused shapes turn WTI’s supply-driven range and dated catalysts into an asset. A naive scalper has to survive gaps it cannot see coming. The practical route is to build one of these shapes yourself. The Builder ships templates that accept oil and exposes every parameter, including the event-pause and stop settings — then test it (below) before you trust a single number.
Best Trading Hours for WTI Oil EAs
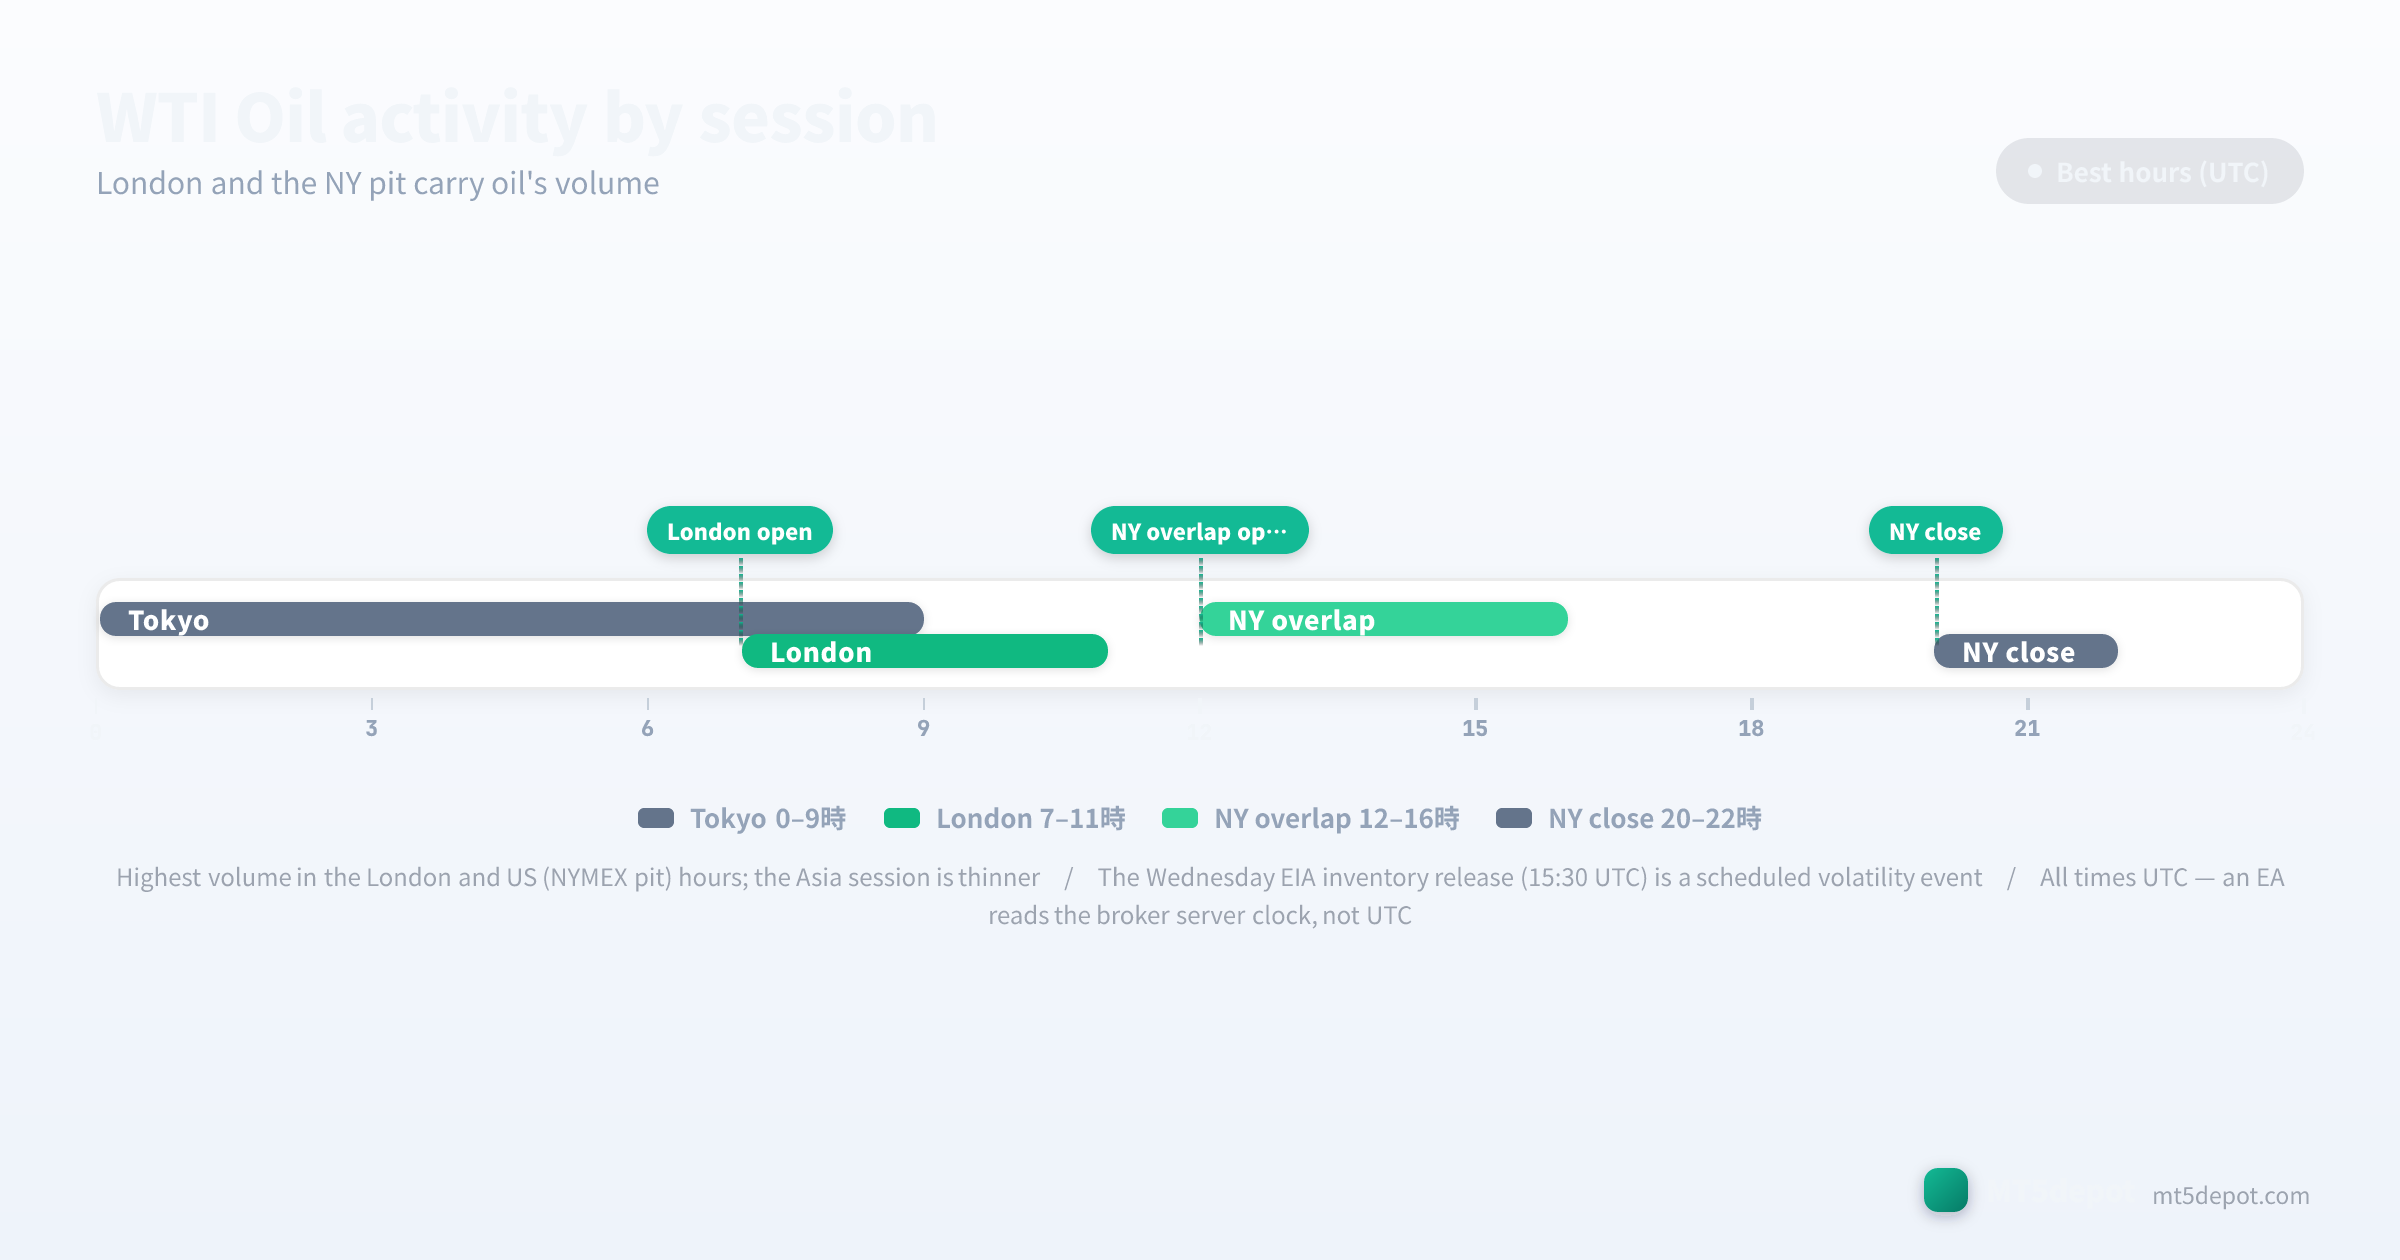
Session structure decides more of a WTI result than indicator choice does:
- Asia session (roughly 22:00–07:00 UTC): thinner liquidity and lower conviction. Oil can drift or print breakouts here that fail once London and the US pit arrive — a window a session filter should treat with caution.
- London session (07:00–16:00 UTC): volume builds and the European day sets the tone. Trend and event-paused EAs on WTI begin to find cleaner signals here as real depth returns.
- US / NYMEX pit hours and NY overlap (12:00–19:00 UTC): oil’s primary window, where the most volume trades. Crucially it contains the Wednesday EIA inventory release at ~15:30 UTC — a scheduled jolt sitting inside the busiest hours that widens the spread and gaps the price exactly then. A fast strategy needs a news pause around it, or it pays for the surprise at the worst moment.
- Late US into the overnight (19:00–22:00 UTC): activity fades and conviction drops; false signals return as depth thins out.
In our editorial assessment, EAs that concentrate on the London-and-US hours often out-perform 24-hour variants on oil. Treat a session filter as part of the strategy definition rather than an optimisation flourish. One rule anchors every time above: they are all UTC. An EA reads your broker’s server clock, which is usually not UTC, so a “15:30” inventory pause shifts silently when you move the EA between brokers on different server timezones. Verify it once in MT5’s Market Watch, and every session boundary and the inventory pause line up.
Spreads, Costs, and Execution
WTI is quoted and costed in US dollars per barrel, not forex pips, and that unit is the first thing an FX-shaped cost model gets wrong. The figures below are editorial reference midpoints from broker-published commodity-CFD conditions (updated July 2026), not broker-by-broker measured numbers. Confirm the live spread and contract details on your own account before you size a fast strategy:
| Cost component | Typical WTI Oil figure | Notes |
|---|---|---|
| Spread | 0.03 – 0.06 USD / barrel | tightens in London and US hours; widens sharply on inventory and OPEC events |
| Commission | account property | on raw/ECN accounts; the same schedule as your other instruments, not an oil-specific charge |
| Overnight financing | swap / storage adjustment | oil CFDs commonly carry a financing or roll adjustment on held positions — check your broker’s rate |
Two cost rules specific to this instrument:
- Cost is in dollars per barrel, and the spread balloons on the calendar. A 0.03–0.06 USD spread is small against a ~2.00 USD day, but that is the quiet-hours figure. Around the Wednesday inventory print and OPEC headlines it can widen several-fold for seconds, so a cost model must budget for the event spread, not the calm one.
- Financing, not commission, is the oil-specific cost. The raw/ECN commission your account charges applies to oil as it does to a forex major. What changes on WTI is the overnight financing or roll adjustment on held positions, which a swing or trend EA carrying a position for days must include. A strategy validated with no financing cost is a different strategy from the one you run.
Risks to Test Before Going Live
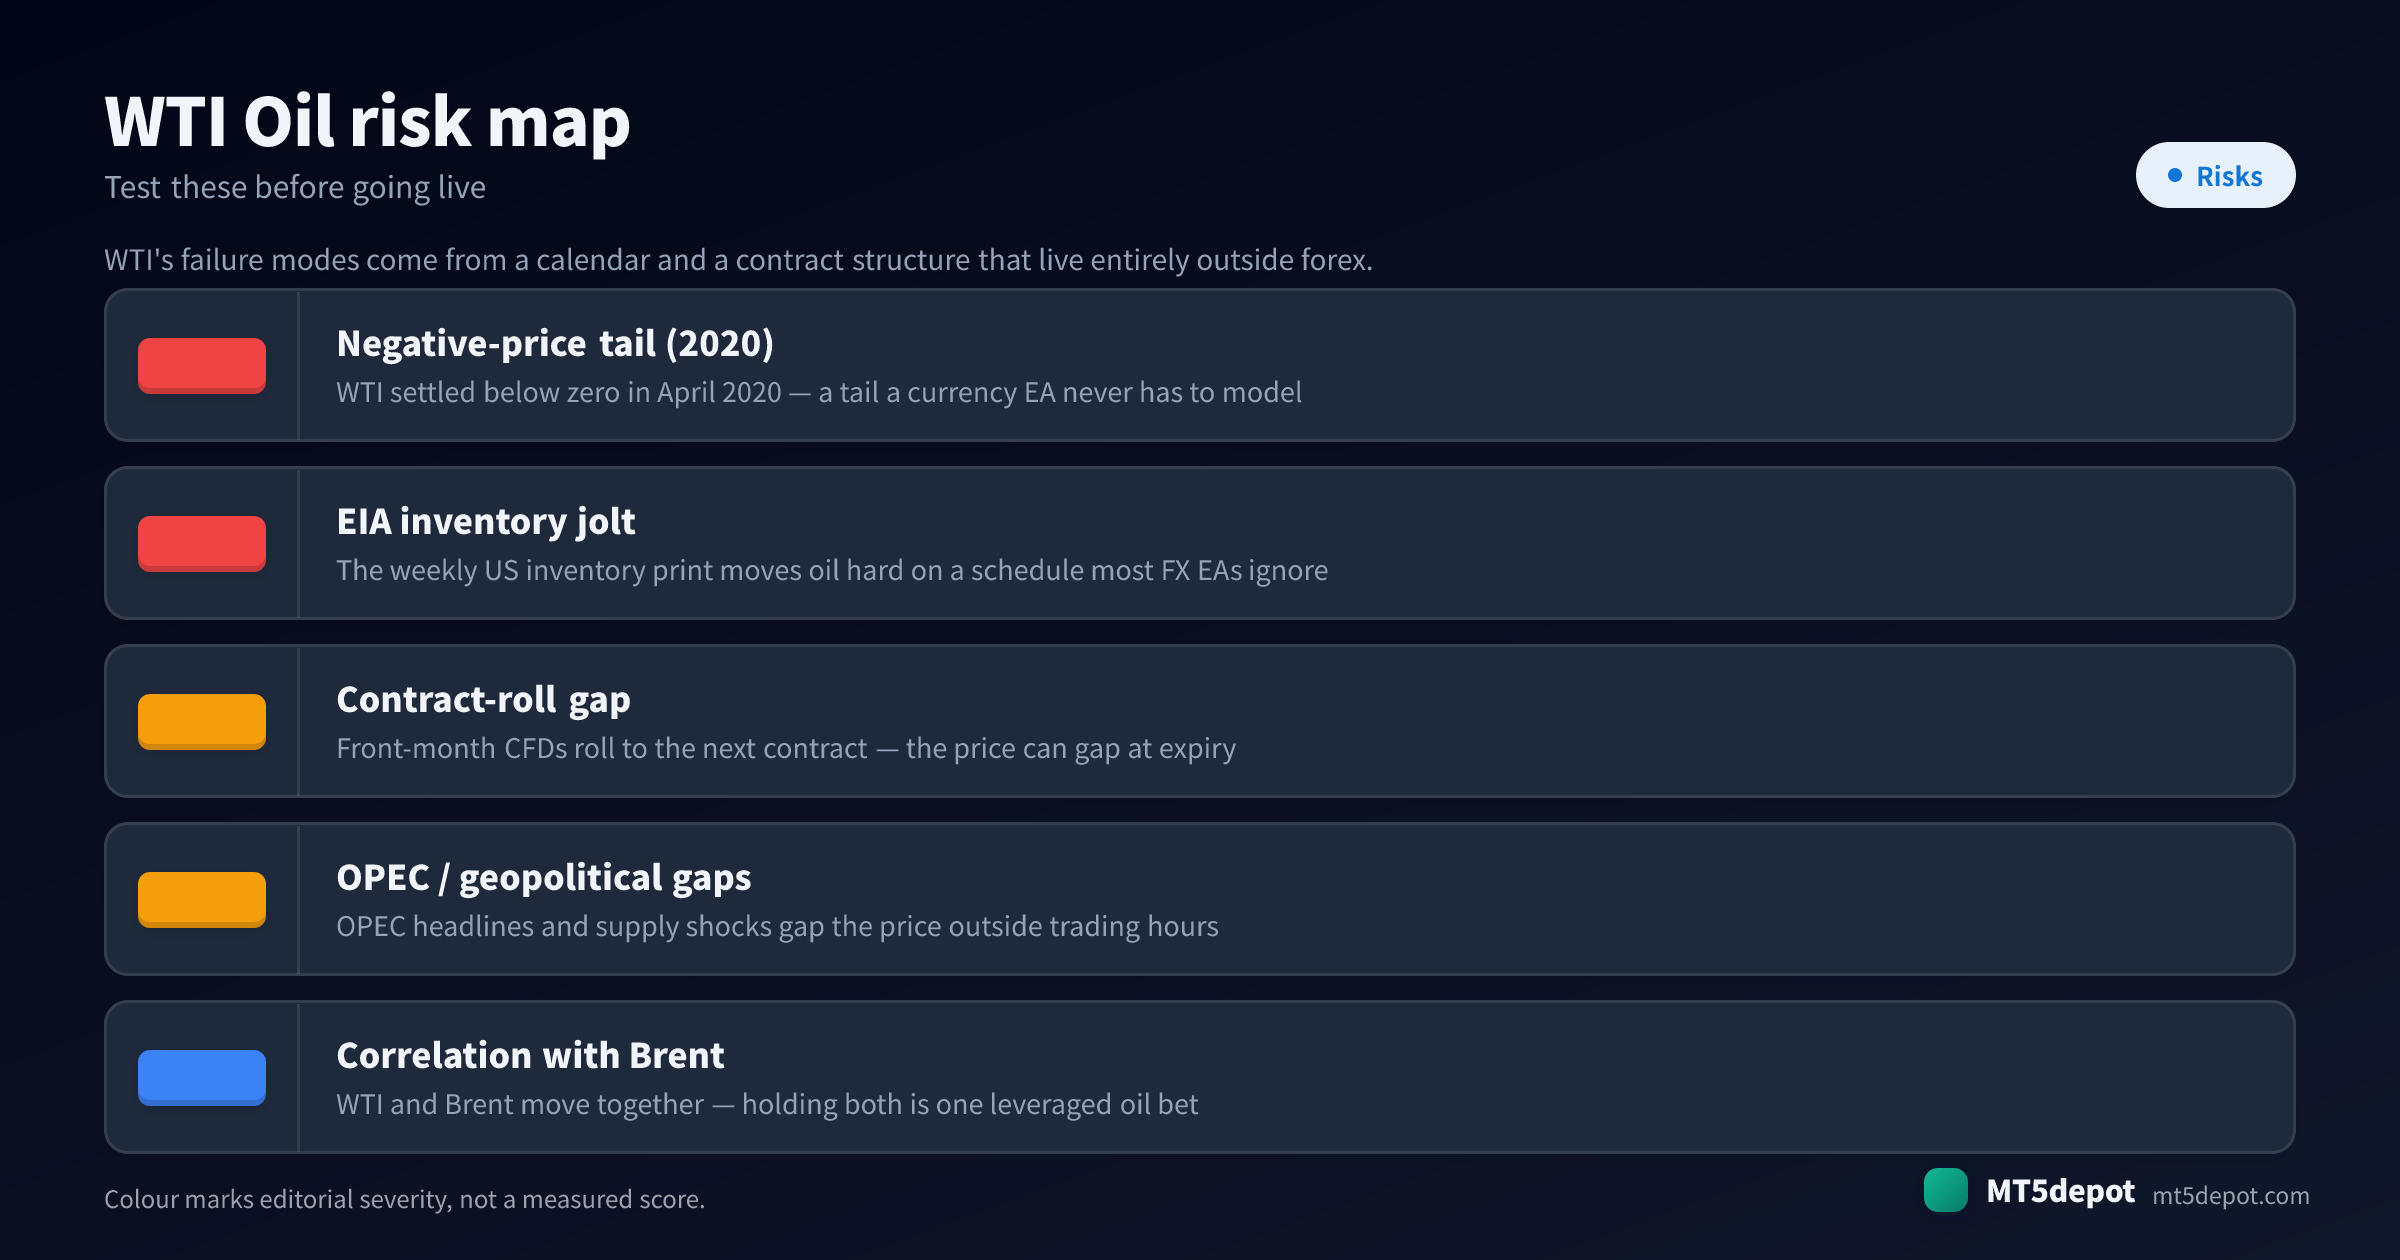
WTI’s failure modes come from a calendar and a contract structure that live entirely outside forex. A generic FX risk checklist misses most of them:
- The negative-price tail (April 2020). The May 2020 WTI futures contract settled below zero as storage at Cushing filled and holders paid to offload barrels rather than take delivery. Because most oil CFDs track the front month, that collapse reached leveraged accounts. This is documented history, not a forecast, but it is a tail a currency EA never has to model. Stress-test against a scenario no FX system would ever encounter.
- The EIA inventory jolt. The weekly US inventory print (Wednesday, ~15:30 UTC) moves oil hard on a schedule most FX EAs ignore. An EA holding a tight stop into that release is exposed to a known, dated event. The fix is a news pause, not a wider stop.
- The front-month contract-roll gap. As the CFD rolls from the expiring front month to the next contract, the price can gap or take a cash adjustment. A price-only EA can read that discontinuity as a real move, or have a stop jumped by it. Model the roll and know your broker’s method before you go live.
- OPEC and geopolitical gaps outside hours. OPEC decisions and supply shocks routinely land over a weekend or between sessions and gap the price when no stop can fill at its level. A strategy that assumes it can always exit at its stop is not sized for oil’s gap risk.
- Correlation with Brent is hidden leverage. WTI and Brent move together, so holding both is one leveraged oil bet, not a hedge. Two “diversified” oil EAs concentrate exposure on the same driver without appearing in either EA’s risk settings.
How to Test a WTI Oil EA
On oil, the test is the whole edge. Hold anything you build to the bar set out in the site’s methodology.
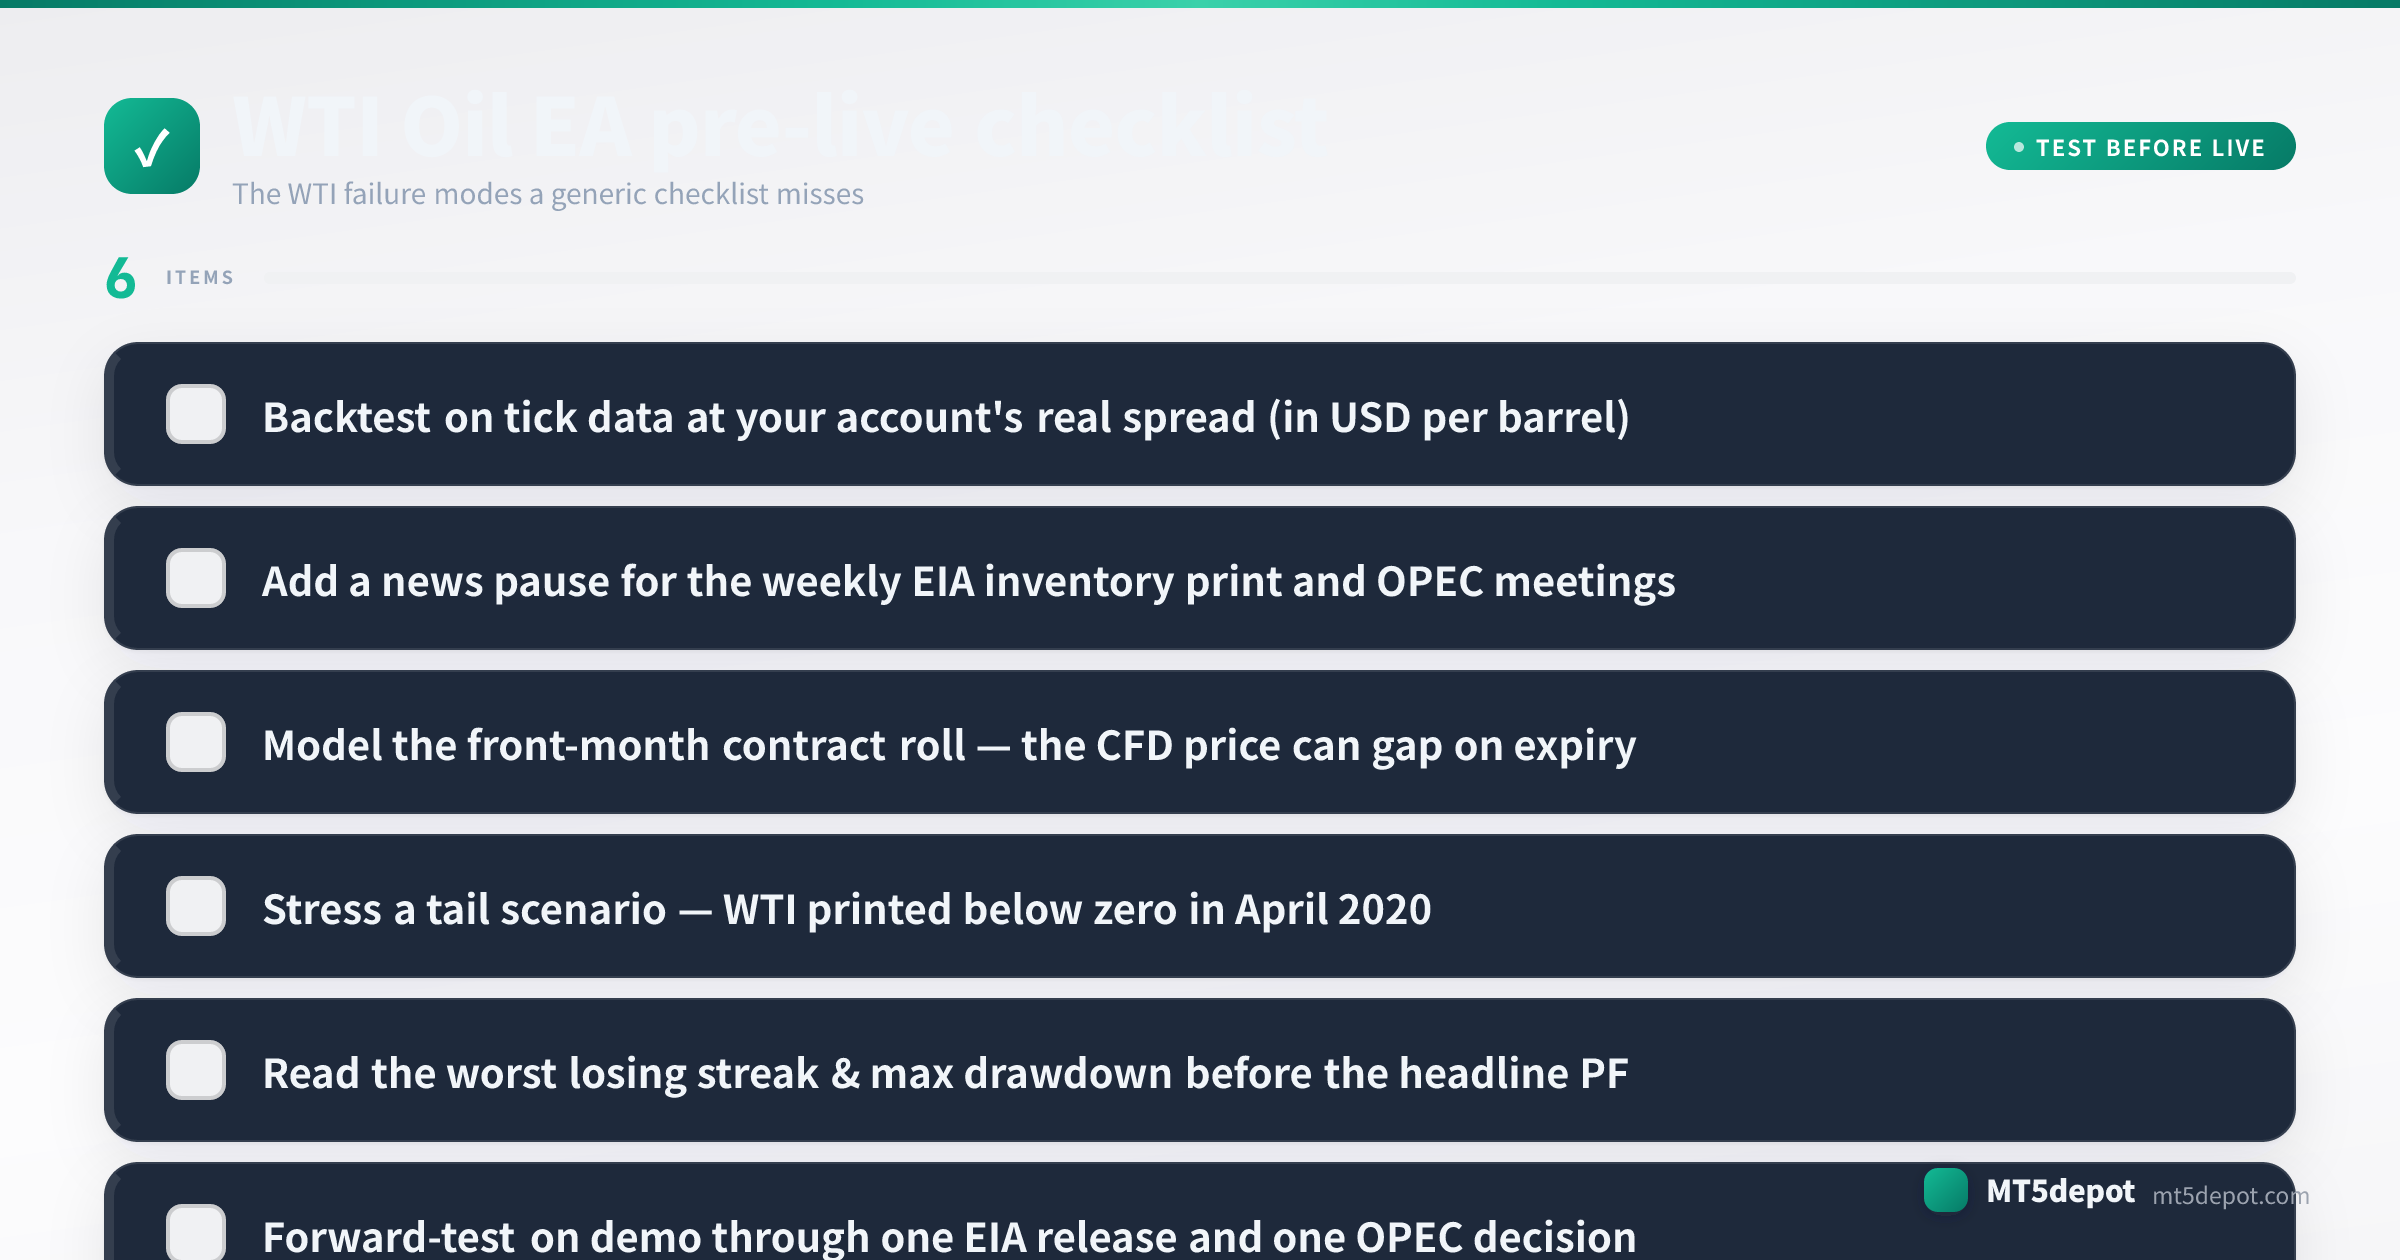
- Backtest on tick data at your account’s real spread, in dollars per barrel. Use an every-tick model with the 0.03–0.06 USD spread you will actually trade plus any overnight financing, not the platform default. On oil, the gap between the calm spread and the event spread is where a clean backtest turns into a losing account.
- Read the worst losing streak, then stress the tail. Read the max drawdown and the longest run of losing trades in account-currency terms before the headline profit factor. Then separately stress a tail scenario: WTI printed below zero in April 2020, so a system that assumes price cannot go where it has already been is untested.
- Forward-test on demo through one EIA release and one OPEC decision. Oil’s defining risk shows up around a supply catalyst. A demo window that never spans a Wednesday inventory print or an OPEC meeting has not tested what matters most — and watch how the EA behaves across a contract-roll date in the same window.
- Confirm the server clock before the first live trade. Re-check MT5’s Market Watch time against the UTC session hours and the 15:30 inventory window above, and again after any broker migration. A mis-set clock puts the news pause on the wrong minute.
Every backtest number this produces is a historical measurement, not a forecast — size for the drawdown you measured and the tail you stressed, not the return you hope for.
WTI Oil EAs and Builder Templates
We have not published a WTI backtest of our own, and a forex result does not carry over to an instrument with a weekly inventory jolt and an expiring contract underneath the price. The honest route to an oil EA is to build and verify one:
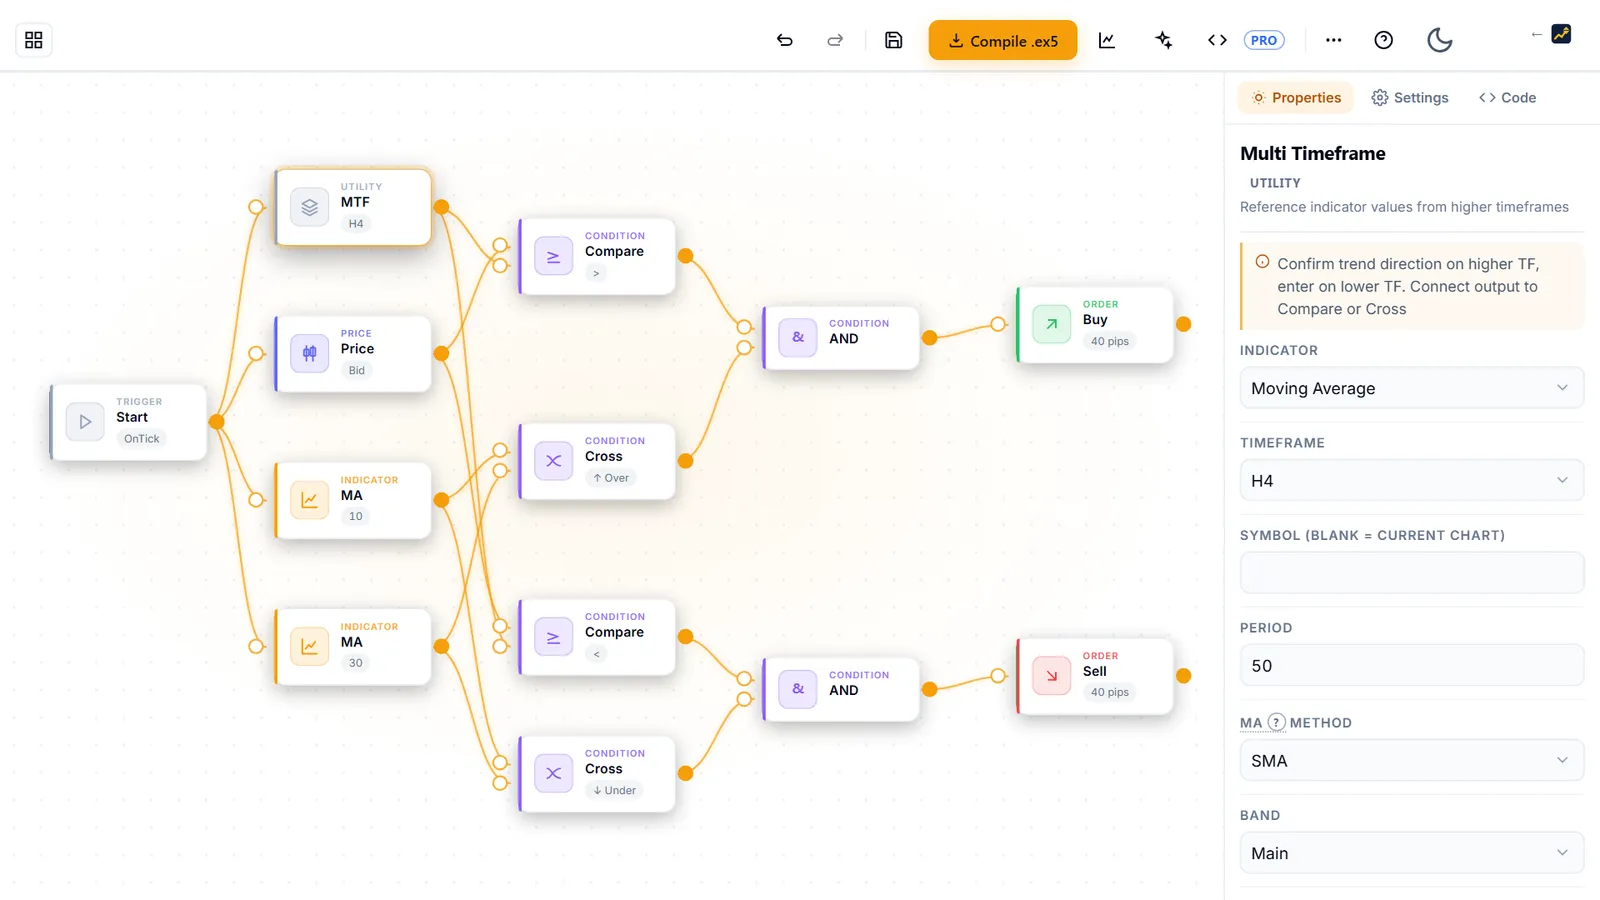
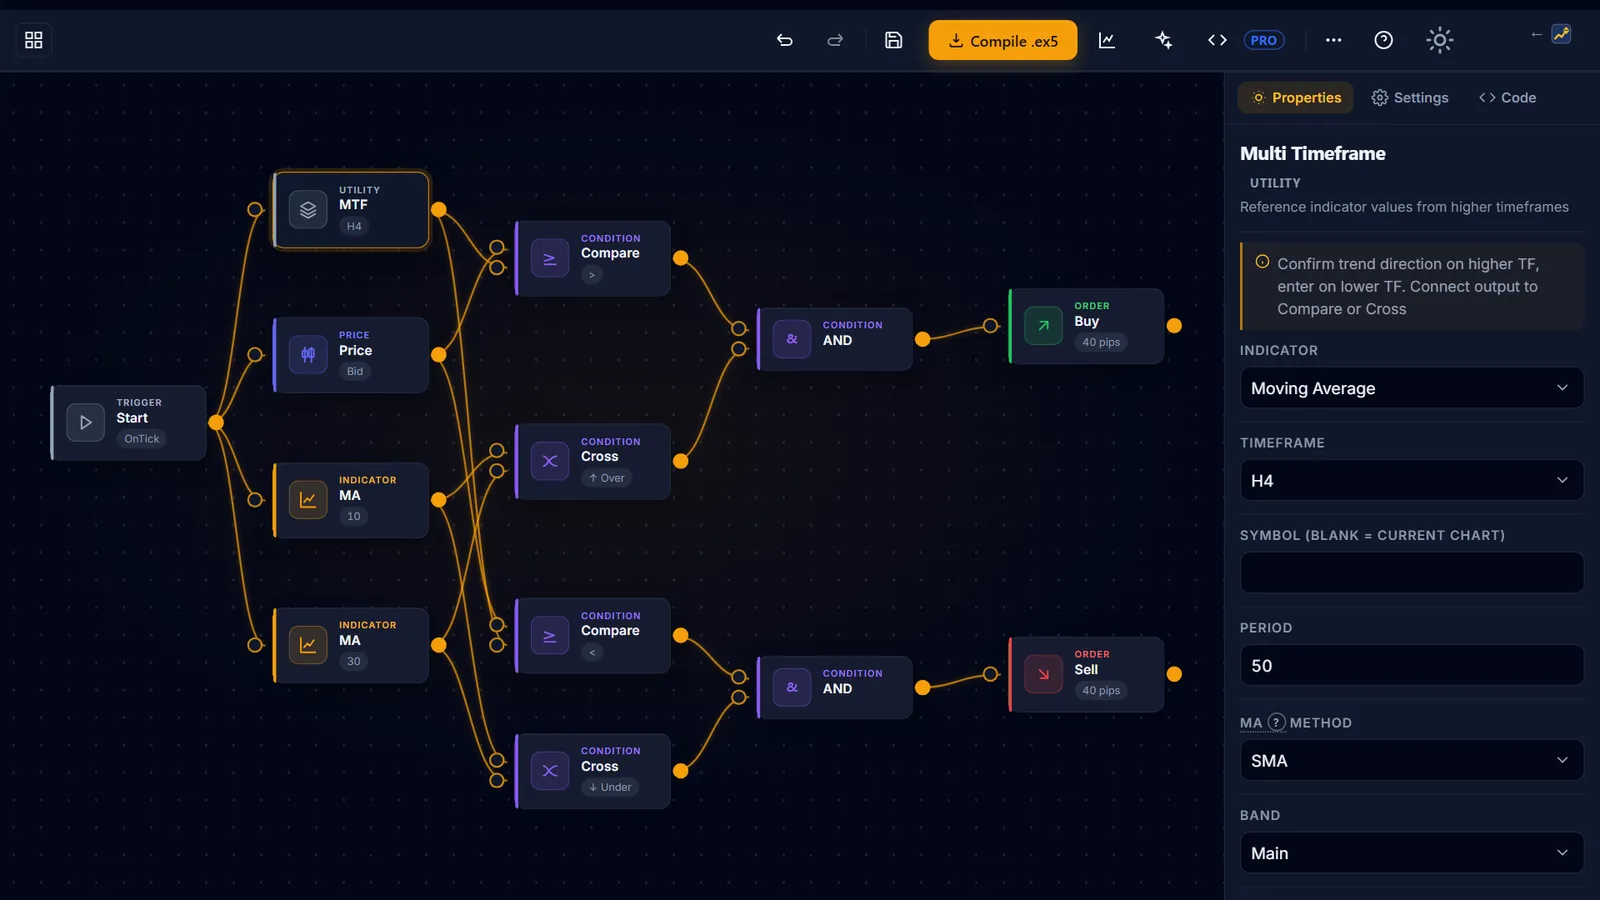
- The Builder (open it here) accepts WTI in its trend templates, and its News Filter node adds an event pause. It exposes every parameter — crucially the event-pause and stop settings that decide whether a strategy survives the inventory print and a roll date.
- Broker and account fit. Oil’s spread, overnight financing and contract-roll handling all depend on the account. Check those conditions on your own broker before you size anything, and the roll method in particular varies between providers.
- The concept canonicals. If a term above is unfamiliar, the volatility, ATR and leverage entries define the mechanics an oil EA depends on most.